Unlock a world of possibilities! Login now and discover the exclusive benefits awaiting you.

- Qlik Community
- :
- All Forums
- :
- QlikView
- :
- Re: Monthwise Values Instead Of YTD
- Subscribe to RSS Feed
- Mark Topic as New
- Mark Topic as Read
- Float this Topic for Current User
- Bookmark
- Subscribe
- Mute
- Printer Friendly Page

 ashish_2511
- Mark as New
- Bookmark
- Subscribe
- Mute
- Subscribe to RSS Feed
- Permalink
- Report Inappropriate Content
Monthwise Values Instead Of YTD
Hi there
I've the following issue. Appreciate any quick help -
I've a pivot table like this -

Please Note-
The actual table in qlikview is actually a transpose of it where month-year is a dimension(The above mentioned table is not even the source, It's just a sample provided by client).
The data that comes from source are ytd values. Hence Feb-15 actuals would be Feb-15 data - Jan-15 data = 12883
Can anybody suggest how to achieve this at an expression level.
The Current expression that i'm using to calculate 'Connection Sales to Public' is - Only({<[Account Description] = {'412104*'}>}[YTD-Budget]). Need a modified expression instead though.
Regards
-Sneh
- « Previous Replies
-
- 1
- 2
- Next Replies »
Accepted Solutions

 sunny_talwar
- Mark as New
- Bookmark
- Subscribe
- Mute
- Subscribe to RSS Feed
- Permalink
- Report Inappropriate Content
Are you looking to get this?
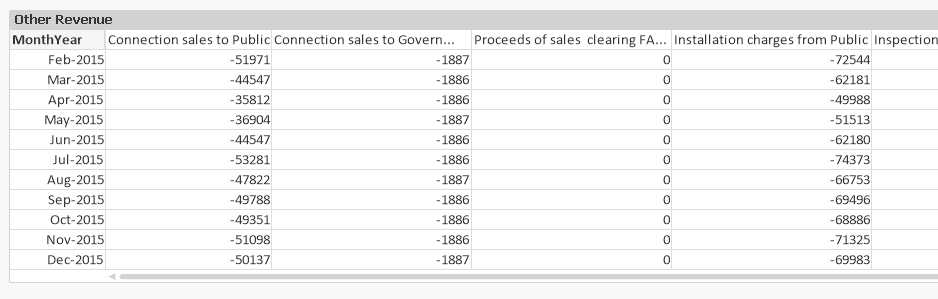
Expressions used
Only({<[Account Description] = {'412104*'}>}[YTD-Budget]) - Above(Only({<[Account Description] = {'412104*'}>}[YTD-Budget]))
Only({<[Account Description] = {'412105*'}>}[YTD-Budget]) - Above(Only({<[Account Description] = {'412105*'}>}[YTD-Budget]))
...
and so on
sunny_talwar
- Mark as New
- Bookmark
- Subscribe
- Mute
- Subscribe to RSS Feed
- Permalink
- Report Inappropriate Content
What exactly are you trying to accomplish? I am not sure I understand how your data looks and what you are trying to achieve out of it. Can you may be provide a better sample with expected output?
ashish_2511
- Mark as New
- Bookmark
- Subscribe
- Mute
- Subscribe to RSS Feed
- Permalink
- Report Inappropriate Content
Dear Sunny
Thanks For your Quick response.
Hope this will help you understand the scenario better -
Source data comes from month-wise excel sheets, like one excel for one month.
Now I've a column called YTD Budget which gives me the numbers per month.
So, Now lets say January file has YTD Budget = 100 (From the excel) and Feb has 300.
In report I need to show
Month-Year YTD Budget
Jan-2016 100
Feb-2016 200(300-100)
Attached is a Reduced qvw. DM table is TB_Files.
Please see the Visualization table as well (There's just one).
sunny_talwar
- Mark as New
- Bookmark
- Subscribe
- Mute
- Subscribe to RSS Feed
- Permalink
- Report Inappropriate Content
I think there is no data in the attached sample. It is all empty. Can you reattach with data in it 

 neelamsaroha157
- Mark as New
- Bookmark
- Subscribe
- Mute
- Subscribe to RSS Feed
- Permalink
- Report Inappropriate Content
If you have Month-Year as dimension(not pivoted) then you can use Your_Expression - Above(Your_Exp)
and if you are pivoting for Moth-Year Dim then use Your_Expression - Before(Your_Exp)
 Digvijay_Singh
- Mark as New
- Bookmark
- Subscribe
- Mute
- Subscribe to RSS Feed
- Permalink
- Report Inappropriate Content
You may think of calculating new month wise budget field in script using Peek/Previous function. Chart preparation would be easier.
ashish_2511
- Mark as New
- Bookmark
- Subscribe
- Mute
- Subscribe to RSS Feed
- Permalink
- Report Inappropriate Content
Dear Sunny
Please see this one.
ashish_2511
- Mark as New
- Bookmark
- Subscribe
- Mute
- Subscribe to RSS Feed
- Permalink
- Report Inappropriate Content
Could you please post an example.
sunny_talwar
- Mark as New
- Bookmark
- Subscribe
- Mute
- Subscribe to RSS Feed
- Permalink
- Report Inappropriate Content
Are you looking to get this?
Expressions used
Only({<[Account Description] = {'412104*'}>}[YTD-Budget]) - Above(Only({<[Account Description] = {'412104*'}>}[YTD-Budget]))
Only({<[Account Description] = {'412105*'}>}[YTD-Budget]) - Above(Only({<[Account Description] = {'412105*'}>}[YTD-Budget]))
...
and so on
ashish_2511
- Mark as New
- Bookmark
- Subscribe
- Mute
- Subscribe to RSS Feed
- Permalink
- Report Inappropriate Content
Thanks a lot Sunny . this works for me.
I slightly modified it to -
If(RowNo()=1,Only({<[Account Description] = {'412104*'}>}[YTD-Budget]),Only({<[Account Description] = {'412104*'}>}[YTD-Budget]) - Above(Only({<[Account Description] = {'412104*'}>}[YTD-Budget])))
Which gives me the Jan-2015 value as well.
It would be great if you could also suggest a way to implement this at the script level.
Regards
-Sneh

- « Previous Replies
-
- 1
- 2
- Next Replies »