Unlock a world of possibilities! Login now and discover the exclusive benefits awaiting you.
- Qlik Community
- :
- All Forums
- :
- QlikView
- :
- Re: Restrict Field Value in line chart
- Subscribe to RSS Feed
- Mark Topic as New
- Mark Topic as Read
- Float this Topic for Current User
- Bookmark
- Subscribe
- Mute
- Printer Friendly Page
- Mark as New
- Bookmark
- Subscribe
- Mute
- Subscribe to RSS Feed
- Permalink
- Report Inappropriate Content
Restrict Field Value in line chart
Hello everyone
I come to know how to restrict field value in line chart.
I have 5 values in KPI but want to show only 4 values in line chart.
how restrict it?
Thanks.
- Mark as New
- Bookmark
- Subscribe
- Mute
- Subscribe to RSS Feed
- Permalink
- Report Inappropriate Content
=if(GetSelectedCount(Region) > 'Central',Region, IF(NOT MATCH(Region, 'Central'), Region))
- Mark as New
- Bookmark
- Subscribe
- Mute
- Subscribe to RSS Feed
- Permalink
- Report Inappropriate Content
not working
- Mark as New
- Bookmark
- Subscribe
- Mute
- Subscribe to RSS Feed
- Permalink
- Report Inappropriate Content
prachi DHOK wrote:
not working
What about?
- Mark as New
- Bookmark
- Subscribe
- Mute
- Subscribe to RSS Feed
- Permalink
- Report Inappropriate Content
=IF(Region <> 'Central',Region)
use above calculated dimension
and don't forget to tick suppress null values for this calculated dimension
- Mark as New
- Bookmark
- Subscribe
- Mute
- Subscribe to RSS Feed
- Permalink
- Report Inappropriate Content
i already used this.
its same as below expression
=if(GetSelectedCount(Region) > 'Central',Region, IF(NOT MATCH(Region, 'Central'), Region))
- Mark as New
- Bookmark
- Subscribe
- Mute
- Subscribe to RSS Feed
- Permalink
- Report Inappropriate Content
So what is your requirement?
- Mark as New
- Bookmark
- Subscribe
- Mute
- Subscribe to RSS Feed
- Permalink
- Report Inappropriate Content
i have KPI field which is contain 5 value but i want to show only 4 kpi's in line chart(without hard coded).
- Mark as New
- Bookmark
- Subscribe
- Mute
- Subscribe to RSS Feed
- Permalink
- Report Inappropriate Content
in your shared app, i can see only 4 values.But you are saying it has 5..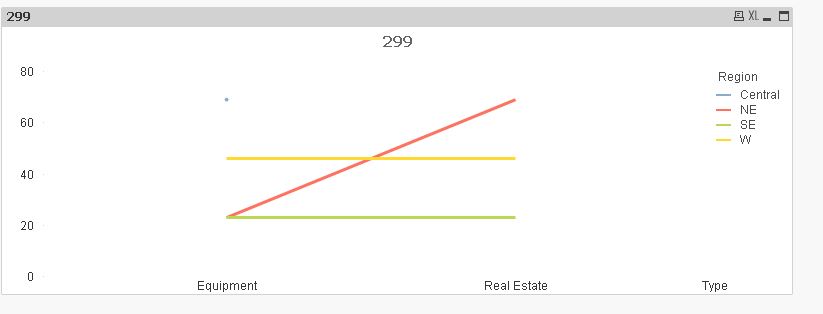
- Mark as New
- Bookmark
- Subscribe
- Mute
- Subscribe to RSS Feed
- Permalink
- Report Inappropriate Content
Use script level
IF(Region <> 'Central',Region) as Region1
Then use Region1 as Dimension
- Mark as New
- Bookmark
- Subscribe
- Mute
- Subscribe to RSS Feed
- Permalink
- Report Inappropriate Content
If you don't want hardcoded dimension exclusion/inclusion values, then how do you want to tell QlikView which value must be excluded? Do you want to select the value to exclude from a listbox? Or do you want to see just a maximum of 4 values, whatever their order? Or maybe just those 4 with the highest aggregation result?