Unlock a world of possibilities! Login now and discover the exclusive benefits awaiting you.

- Qlik Community
- :
- All Forums
- :
- QlikView
- :
- Re: Set Expression for Sales
- Subscribe to RSS Feed
- Mark Topic as New
- Mark Topic as Read
- Float this Topic for Current User
- Bookmark
- Subscribe
- Mute
- Printer Friendly Page

 arethaking
- Mark as New
- Bookmark
- Subscribe
- Mute
- Subscribe to RSS Feed
- Permalink
- Report Inappropriate Content
Set Expression for Sales
Hi All,
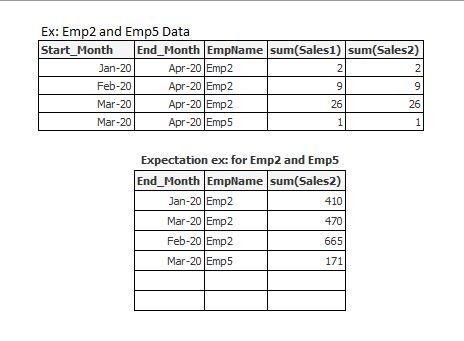
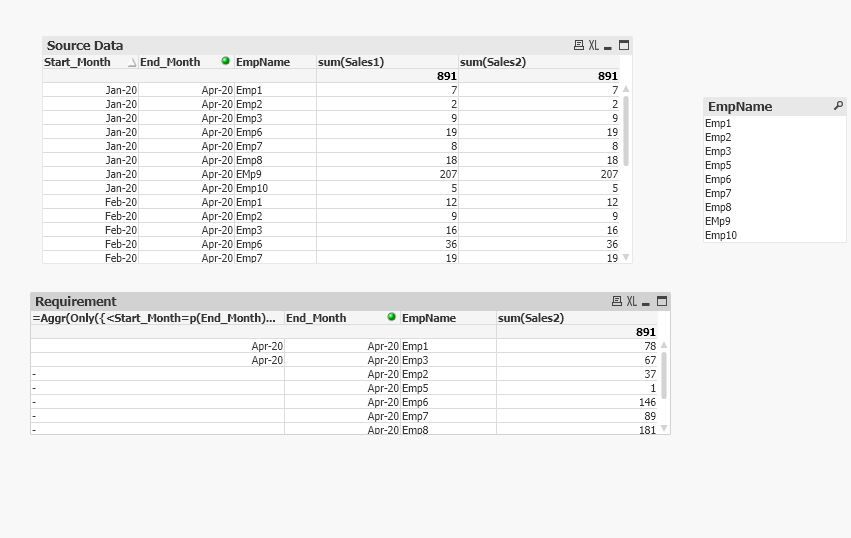
I want to find the Sales2 for my below dataset.
For selections:
End_Month Apr-20,Emp2 there are no APR-20 Sales1 values but Sales1 data is there for JAN-20,FEB-20,MAR-20.
End_Month Apr-20,Emp5 there are no APR-20 Sales1 values but Sales1 data is there for MAR-20
My requirement is to be shown as mentioned below:
For Emp2,End_Month values JAN-20,FEB-20,MAR-20,Sales2
For Emp5,End_Month values , MAR-20,Sales2
End_Month
I wrote this expression seems not working.
=Aggr(Only({<Start_Month=p(End_Month)>}End_Month), End_Month, EmpName)
Accepted Solutions

 jagan
jagan
- Mark as New
- Bookmark
- Subscribe
- Mute
- Subscribe to RSS Feed
- Permalink
- Report Inappropriate Content
Hi,
Please update your script as below
LOAD *,
date(MonthEnd(End_Date),'MMM-YY') & '_' & EmpName as End_Key,
date(MonthEnd(Start_Date),'MMM-YY') & '_' & EmpName as Start_Key,
date(MonthEnd(End_Date),'MMM-YY') as End_Month,
date(MonthEnd(Start_Date),'MMM-YY') as Start_Month,
Year(Start_Date) as Start_Year,Year(End_Date) as End_Year;
LOAD End_Date,
Start_Date,
EmpName,
Sales1,
Sales2
FROM
Data - Copy.xlsx
(ooxml, embedded labels, table is Data);
And create chart as below
Dimensions: EmpName, End_Month
Expression: sum({<End_Key=P({<End_Key=>}Start_Key)>}Sales2)
Regards,
Jagan.
jagan
- Mark as New
- Bookmark
- Subscribe
- Mute
- Subscribe to RSS Feed
- Permalink
- Report Inappropriate Content
Hi,
Please update your script as below
LOAD *,
date(MonthEnd(End_Date),'MMM-YY') & '_' & EmpName as End_Key,
date(MonthEnd(Start_Date),'MMM-YY') & '_' & EmpName as Start_Key,
date(MonthEnd(End_Date),'MMM-YY') as End_Month,
date(MonthEnd(Start_Date),'MMM-YY') as Start_Month,
Year(Start_Date) as Start_Year,Year(End_Date) as End_Year;
LOAD End_Date,
Start_Date,
EmpName,
Sales1,
Sales2
FROM
Data - Copy.xlsx
(ooxml, embedded labels, table is Data);
And create chart as below
Dimensions: EmpName, End_Month
Expression: sum({<End_Key=P({<End_Key=>}Start_Key)>}Sales2)
Regards,
Jagan.
jagan
- Mark as New
- Bookmark
- Subscribe
- Mute
- Subscribe to RSS Feed
- Permalink
- Report Inappropriate Content
Try this it is working for End Month Selection
sum({<End_Month=, End_Key=P({<End_Month=, End_Key=>}Start_Key)>}Sales2)
jagan
- Mark as New
- Bookmark
- Subscribe
- Mute
- Subscribe to RSS Feed
- Permalink
- Report Inappropriate Content
Please find attached file for solution.
