Unlock a world of possibilities! Login now and discover the exclusive benefits awaiting you.

- Qlik Community
- :
- All Forums
- :
- QlikView
- :
- Re: Working with two dims in a graph
- Subscribe to RSS Feed
- Mark Topic as New
- Mark Topic as Read
- Float this Topic for Current User
- Bookmark
- Subscribe
- Mute
- Printer Friendly Page

- Mark as New
- Bookmark
- Subscribe
- Mute
- Subscribe to RSS Feed
- Permalink
- Report Inappropriate Content
Working with two dims in a graph
I usually find confusing the representation of tow dimension in a graph.
I have only a expression, but two dims.
Is there any best practices in Qlickview to deal with 2 dims in a graph?
Thanks in advance,
- Tags:
- new_to_qlikview
- « Previous Replies
-
- 1
- 2
- Next Replies »
Accepted Solutions

 maleksafa
- Mark as New
- Bookmark
- Subscribe
- Mute
- Subscribe to RSS Feed
- Permalink
- Report Inappropriate Content
can you give more example on the type of chart you are dealing with, if it is a straight or pivot chart then there are no problem, now sometimes with bar/line charts you face some issues, and what you can do is to create one dimension which is a concatenation of the 2 dimensions that you want to show.

 beck_bakytbek
- Mark as New
- Bookmark
- Subscribe
- Mute
- Subscribe to RSS Feed
- Permalink
- Report Inappropriate Content
Hi Juan
What do you mean exactly. you can use in such cases the cyclic-group.
Beck
maleksafa
- Mark as New
- Bookmark
- Subscribe
- Mute
- Subscribe to RSS Feed
- Permalink
- Report Inappropriate Content
can you give more example on the type of chart you are dealing with, if it is a straight or pivot chart then there are no problem, now sometimes with bar/line charts you face some issues, and what you can do is to create one dimension which is a concatenation of the 2 dimensions that you want to show.
- Mark as New
- Bookmark
- Subscribe
- Mute
- Subscribe to RSS Feed
- Permalink
- Report Inappropriate Content
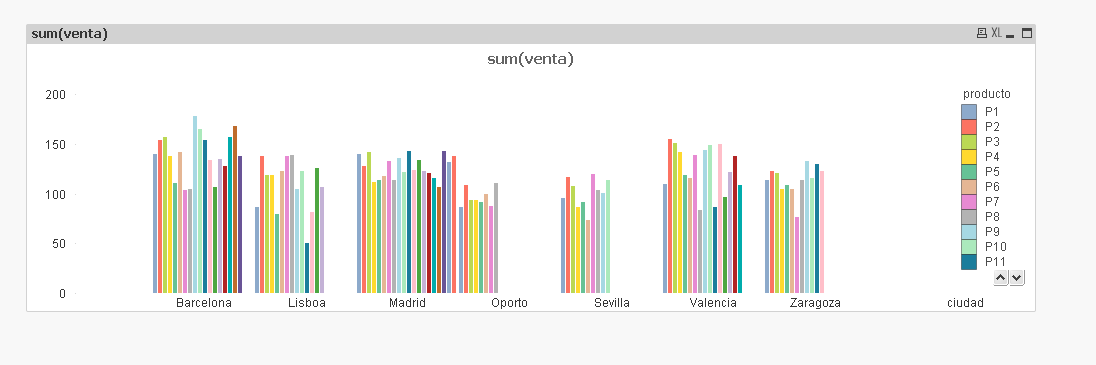
I am working with a bar graph, I think is the best graph to show the values with 2 dims, isn't it?
To make a cyclic-gruop is useful too.
If you have any other advice to visualize the data, tell me please...
Thanks in advance

 awhitfield
- Mark as New
- Bookmark
- Subscribe
- Mute
- Subscribe to RSS Feed
- Permalink
- Report Inappropriate Content
Hi Juan,
can you post a example qvw? Do you want to display both of the two dimensions at the same time?
Andy
- Mark as New
- Bookmark
- Subscribe
- Mute
- Subscribe to RSS Feed
- Permalink
- Report Inappropriate Content
I want to display both at the same time.
I would like to know the best practices in thsi cases
Thanks!!
- Mark as New
- Bookmark
- Subscribe
- Mute
- Subscribe to RSS Feed
- Permalink
- Report Inappropriate Content
Can't you use 2 expressions and even colour them? It could be a solution.
- Mark as New
- Bookmark
- Subscribe
- Mute
- Subscribe to RSS Feed
- Permalink
- Report Inappropriate Content
My expresion is very simple: sum(venta)
over ciudad and producto
but I don't know what do yoy mean by using two expression
can you give an example?
Thanks
- Mark as New
- Bookmark
- Subscribe
- Mute
- Subscribe to RSS Feed
- Permalink
- Report Inappropriate Content
Also you can try using treilis : https://www.youtube.com/watch?v=y5-xEQKklMw
Or try using cyclic group: https://www.youtube.com/watch?v=TEQy8JuMpp0
Or Animate 2nd dimension
Or select option in listbox (City or 2nd dim): Always one selected value 
- Mark as New
- Bookmark
- Subscribe
- Mute
- Subscribe to RSS Feed
- Permalink
- Report Inappropriate Content
HI Juan,
Did you tried "STACKED" option in bar chart? (under STYLE tab) .It may give you more ideas
-Jay
- « Previous Replies
-
- 1
- 2
- Next Replies »