Unlock a world of possibilities! Login now and discover the exclusive benefits awaiting you.
- Qlik Community
- :
- Forums
- :
- Groups
- :
- Industry and Topics
- :
- Scalability
- :
- How to click on the dimensions in the chart?
- Subscribe to RSS Feed
- Mark Topic as New
- Mark Topic as Read
- Float this Topic for Current User
- Bookmark
- Subscribe
- Mute
- Printer Friendly Page
- Feature this Topic
- Mark as New
- Bookmark
- Subscribe
- Mute
- Subscribe to RSS Feed
- Permalink
- Report Inappropriate Content
How to click on the dimensions in the chart?
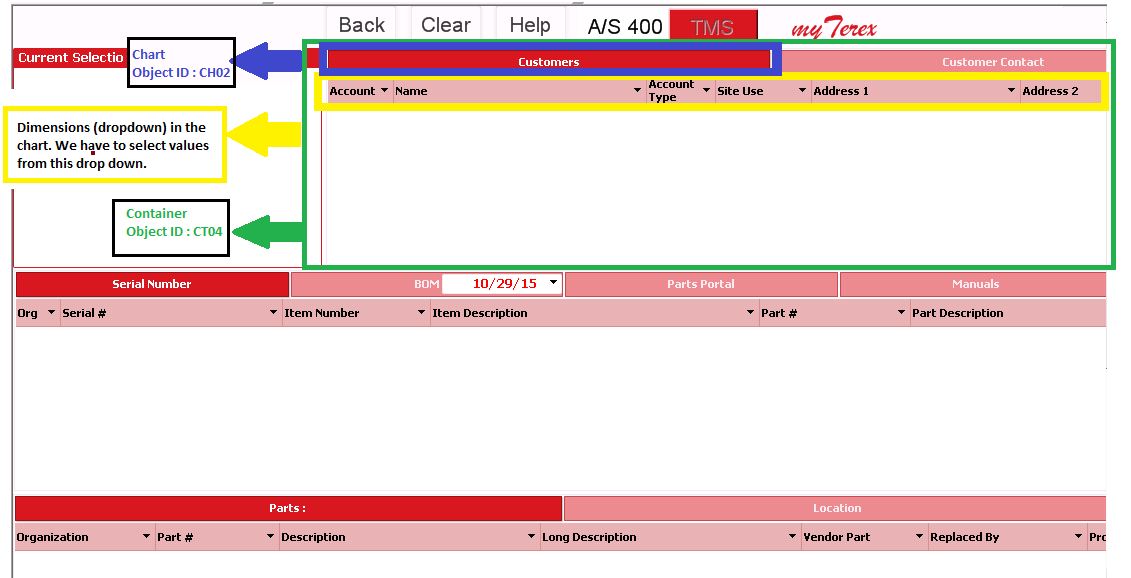
Please refer to the attached image.
Problem Statement : According to the image, we have to select a value from any of the drop-downs (dimensions).
Problem Description: I checked the properties of all the objects in this application in QlikView Desktop. Here, I observed that these drop-downs are not mapped to any Object Ids (like container Id, chart Id etc) instead, these drop-downs are available as different dimensions in the chart. I was able to obtain the other Chart Ids, Container Ids etc from the same QLikView Desktop.
Approaches Tried : I have tried two approaches described below, still no luck:
- I tried all the actions mentioned in the QVScalability Tool .pdf file. The most suitable action was "Straight Table". I successfully scripted using this action. But, the response did not come as required (It loaded the whole template i.e. container Ids, charts Ids and their data as response).
- Instead of IE plugin, I used the full browser version (this shows the ajax requests) to load the .qvw file. With the help of Developer Tool (F12) available in the browser, I tried to capture all the ajax requests. Here the the .qvw file loads, but those dimensions are not displayed as drop-downs instead only their names are displayed (like account, name etc.) We can right click on these dimensions and we have a "sort" option available. Now, every time i click on the "sort" option, I can see an ajax request running in the background but suddenly an "unexpected error" occurs and the browser closes. The error message itself says "Unexpected error occurred".
Please let me know how can we script this piece where I have to select a value from the drop-down (dimension).
- Tags:
- Group_Discussions
- Mark as New
- Bookmark
- Subscribe
- Mute
- Subscribe to RSS Feed
- Permalink
- Report Inappropriate Content
Hello,
It seems you have a straighttable in a container object, so yes you are correct in using that action. You do need to specify the id containerobject in order for it to work though. However, the scalability tool does not support dropdown select which I think is what you want. The workaround I suggest is to create a listbox object in which you can select you dimension to accomplish what you want.
For the second issue, I do not know what causes it but it is unrelated to the sclability tool at least. If it is indeed a bug it can be reported to support.
Cheers
/Sebastian
- Mark as New
- Bookmark
- Subscribe
- Mute
- Subscribe to RSS Feed
- Permalink
- Report Inappropriate Content
Hi Sebastian, thanks a lot for the information.
I have a quick question here: When you suggest that I should create a list box Object, do you mean that assigning an Object Id to these dimensions (drop-downs) would solve my problem?
- Mark as New
- Bookmark
- Subscribe
- Mute
- Subscribe to RSS Feed
- Permalink
- Report Inappropriate Content
Hi, Abhishek.
No, what you need to do is to add regular ListBoxes for the fields, you want to interact with, as separate objects and aim the clicks towards these instead.
This is not always optimal but it is currently the only work-around.
br
/lars
- Mark as New
- Bookmark
- Subscribe
- Mute
- Subscribe to RSS Feed
- Permalink
- Report Inappropriate Content
Hi,
Can anybody suggest how much effort (in terms of Time) is required to replace these Dimensions by ListBox. Reason behind my question is: The application is going to be pushed to the production soon, so I just wanted to calculate whether or not the team has the time to do these changes.
Thanks!
- Mark as New
- Bookmark
- Subscribe
- Mute
- Subscribe to RSS Feed
- Permalink
- Report Inappropriate Content
Hi,
You do not need to replace them, I propose that you temporarily add listboxes using the dimensions you want to select in. That is the way to handle the issue with minimal impact and effort - should take just a few minutes.
cheers
/sebastian
- Mark as New
- Bookmark
- Subscribe
- Mute
- Subscribe to RSS Feed
- Permalink
- Report Inappropriate Content
Hi All,
After digging into the requests for hours, I am able to script the dimensions using JMeter without converting them into the Listbox or any other object.
Here are the details that can help in scripting the QlikView application.
1. If you observe the JMX script that is generated by QVScalability, doesn't utilize the plugin version of the QlikView application, instead it fires the AJAX request.
2. You can open the QlikView application in the AJAX mode as well (for manual transactions) which facilitates you to see the requests which are getting triggered (in developers tool) with each user action.
3. You will observe the following POST body where name and rect are the parameters in which you will be interested in
<update mark="{MARKID}" stamp="${STAMPID}" cookie="true" scope="Document" view="${DOCUMENT}" ident="null"><set name="${NAME}" rect="${CHARTRECT}" /></update>
4. The above request will be followed by the request that will fetch the data that you had requested for and the POST body looks something like this:
<update mark="${MARKID}" stamp="{STAMPID}" cookie="true" scope="Document" view="${DOCUMENT}" ident="null">${POLLSTRING}</update>
${POLLSTRING} can be calculated by using the same code written in Poll string builder OBJECTS (BeanShell PostProcessor) that is written in above request that loads the chart. Use the same BeanShell PostProcessor, place it as a child of the first request and use the ${POLLSTRING} in the second request.
Thanks,
Abhishek