Unlock a world of possibilities! Login now and discover the exclusive benefits awaiting you.
- Qlik Community
- :
- Forums
- :
- Analytics & AI
- :
- Products & Topics
- :
- Visualization and Usability
- :
- Add a total bar to a stacked bar chart
- Subscribe to RSS Feed
- Mark Topic as New
- Mark Topic as Read
- Float this Topic for Current User
- Bookmark
- Subscribe
- Mute
- Printer Friendly Page
- Mark as New
- Bookmark
- Subscribe
- Mute
- Subscribe to RSS Feed
- Permalink
- Report Inappropriate Content
Add a total bar to a stacked bar chart
Hello !
I searched for a solution for this problem for some time now but without succes.
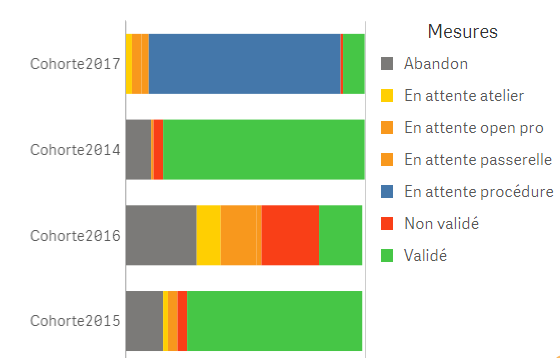
So, what i have is a dimension and a few measures based on percentage i took from the excel that was given to me, i then use them in a stacked bar chart :
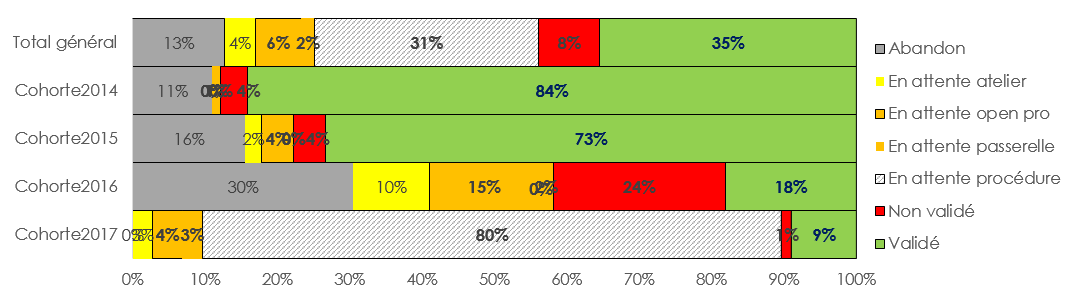
And what i want is add a 'total' bar with the sum of the measures for all the years like so (on excel):
Is there a way to do that?
The data i have roughly look like that :
| client | Year2017 | Year2016 | Year2015 | Year2014 |
|---|---|---|---|---|
| 1 | waiting | |||
| 2 | ok | waiting | ||
| 3 | gave up | |||
| 4 | not ok | |||
| 5 | ok |
my dimension is declared like so :
if(
[Year2014]='' and [Year2015]='' and [Year2016]='',
'Cohorte2017',
    if(
    [Year2014]='' and [Year2015]='',
    'Cohorte2016',
        if(
        [Year2014]='',
            'Cohorte2015',
            'Cohorte2014'
        )
)
)
and here is an example of one of the measures that i then transform into %:
Sum(
  if(
      [Year2017]='' and [Year2016]='' and [Year2015]='' and [Year2014]='',
      0,
      if(
          [Year2017]='',
          if(
              [Year2016]='',
              if(
                  [Year2015]='',
                  if([Year2014]='waiting',1,0),
                  if([Year2015]='waiting',1,0)
              ),
              if([Year2016]='waiting',1,0)
          ),
          if([Year2017]='waiting',1,0)
      )
  )
)
thanks in advance !