Unlock a world of possibilities! Login now and discover the exclusive benefits awaiting you.

Announcements
Want to see what's currently in public preview? We've pulled it all together in one place. Check it out here
- Qlik Community
- :
- Forums
- :
- Analytics & AI
- :
- Products & Topics
- :
- Visualization and Usability
- :
- Adding targets per sales rep
Options
- Subscribe to RSS Feed
- Mark Topic as New
- Mark Topic as Read
- Float this Topic for Current User
- Bookmark
- Subscribe
- Mute
- Printer Friendly Page
Turn on suggestions
Auto-suggest helps you quickly narrow down your search results by suggesting possible matches as you type.
Showing results for

 dries_clairhout
Creator
2019-12-18
04:45 AM
- Mark as New
- Bookmark
- Subscribe
- Mute
- Subscribe to RSS Feed
- Permalink
- Report Inappropriate Content
Adding targets per sales rep
Good day,
I am trying to put monthly targets inside a graph.
This is the graph as is:

Now I want to have a line that shows the target per Salesrep in reference to the numbers.
This is an excel of the data I want to put in visualisation:
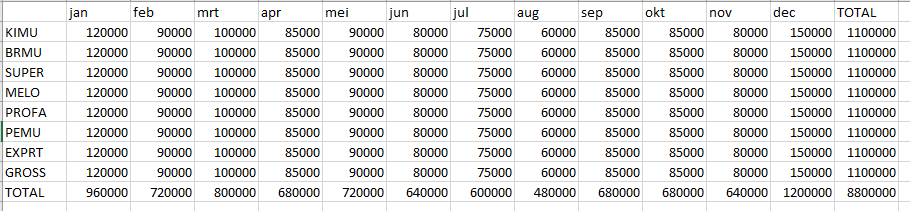
Any ideas would be welcome.
Kind Regards,
Dries
1,234 Views
2 Replies

 Kushal_Chawda
MVP
2019-12-18
04:58 AM
- Mark as New
- Bookmark
- Subscribe
- Mute
- Subscribe to RSS Feed
- Permalink
- Report Inappropriate Content
IS it bar or combo chart? How exactly target like should look like?
dries_clairhout
Creator
2019-12-18
05:00 AM
Author
- Mark as New
- Bookmark
- Subscribe
- Mute
- Subscribe to RSS Feed
- Permalink
- Report Inappropriate Content
Hello,
right now it's a normal bar graph,
but it should be a combochart.
Where we see the sales numbers combared over the months.
and above it a line that represents the targets.
So when i select a certain representative I can see per month if the target is met.
Thanks in advance.
1,224 Views
