Unlock a world of possibilities! Login now and discover the exclusive benefits awaiting you.

- Qlik Community
- :
- Forums
- :
- Analytics & AI
- :
- Products & Topics
- :
- Visualization and Usability
- :
- Average Logons Per Calendar Day
- Subscribe to RSS Feed
- Mark Topic as New
- Mark Topic as Read
- Float this Topic for Current User
- Bookmark
- Subscribe
- Mute
- Printer Friendly Page

 Rnc2005
- Mark as New
- Bookmark
- Subscribe
- Mute
- Subscribe to RSS Feed
- Permalink
- Report Inappropriate Content
Average Logons Per Calendar Day
Chart: #1 KPI
Display: average logons per calendar day
I'm not sure if I've looked at this too long or what, to me this should be SIMPLE, but it's not.
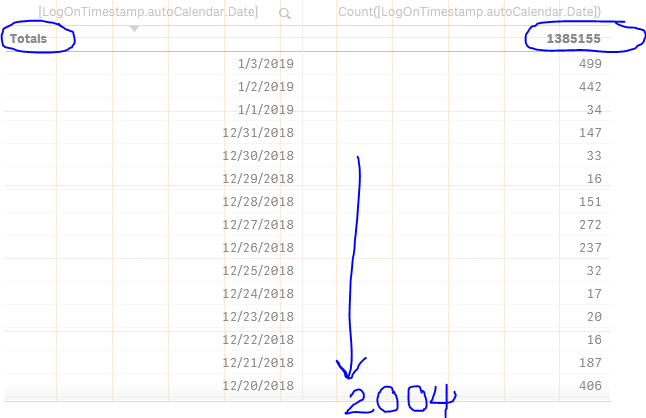
Total logins 1,385,155 / # of days from beginning of time (2004) to current is 5207 days
I should pull back an average daily of 266, but I'm not...I'm pulling back 41,448 😮
Avg([LogOnTimestamp.autoCalendar.Date])
Thanks in advance,
Newbie
Accepted Solutions

 sunny_talwar
- Mark as New
- Bookmark
- Subscribe
- Mute
- Subscribe to RSS Feed
- Permalink
- Report Inappropriate Content
Not entirely sure, but may be try this
Count([LogOnTimestamp.autoCalendar.Date])/Count(DISTINCT [LogOnTimestamp.autoCalendar.Date])
sunny_talwar
- Mark as New
- Bookmark
- Subscribe
- Mute
- Subscribe to RSS Feed
- Permalink
- Report Inappropriate Content
Not entirely sure, but may be try this
Count([LogOnTimestamp.autoCalendar.Date])/Count(DISTINCT [LogOnTimestamp.autoCalendar.Date])
Rnc2005
- Mark as New
- Bookmark
- Subscribe
- Mute
- Subscribe to RSS Feed
- Permalink
- Report Inappropriate Content
The result is 275, but that is way closer than what I was getting so perhaps my # of days were off...I'm considering this a VICTORY!!
Thank you so much!
===Update===
I verified with a smaller data set (one month) and it's PERFECT!!! Thanks again!!!
