Unlock a world of possibilities! Login now and discover the exclusive benefits awaiting you.
- Qlik Community
- :
- Forums
- :
- Analytics & AI
- :
- Products & Topics
- :
- Visualization and Usability
- :
- Avg function not producing the correct value
- Subscribe to RSS Feed
- Mark Topic as New
- Mark Topic as Read
- Float this Topic for Current User
- Bookmark
- Subscribe
- Mute
- Printer Friendly Page
- Mark as New
- Bookmark
- Subscribe
- Mute
- Subscribe to RSS Feed
- Permalink
- Report Inappropriate Content
Avg function not producing the correct value
Qlik Sense Question:
The avg function is not producing the correct value.
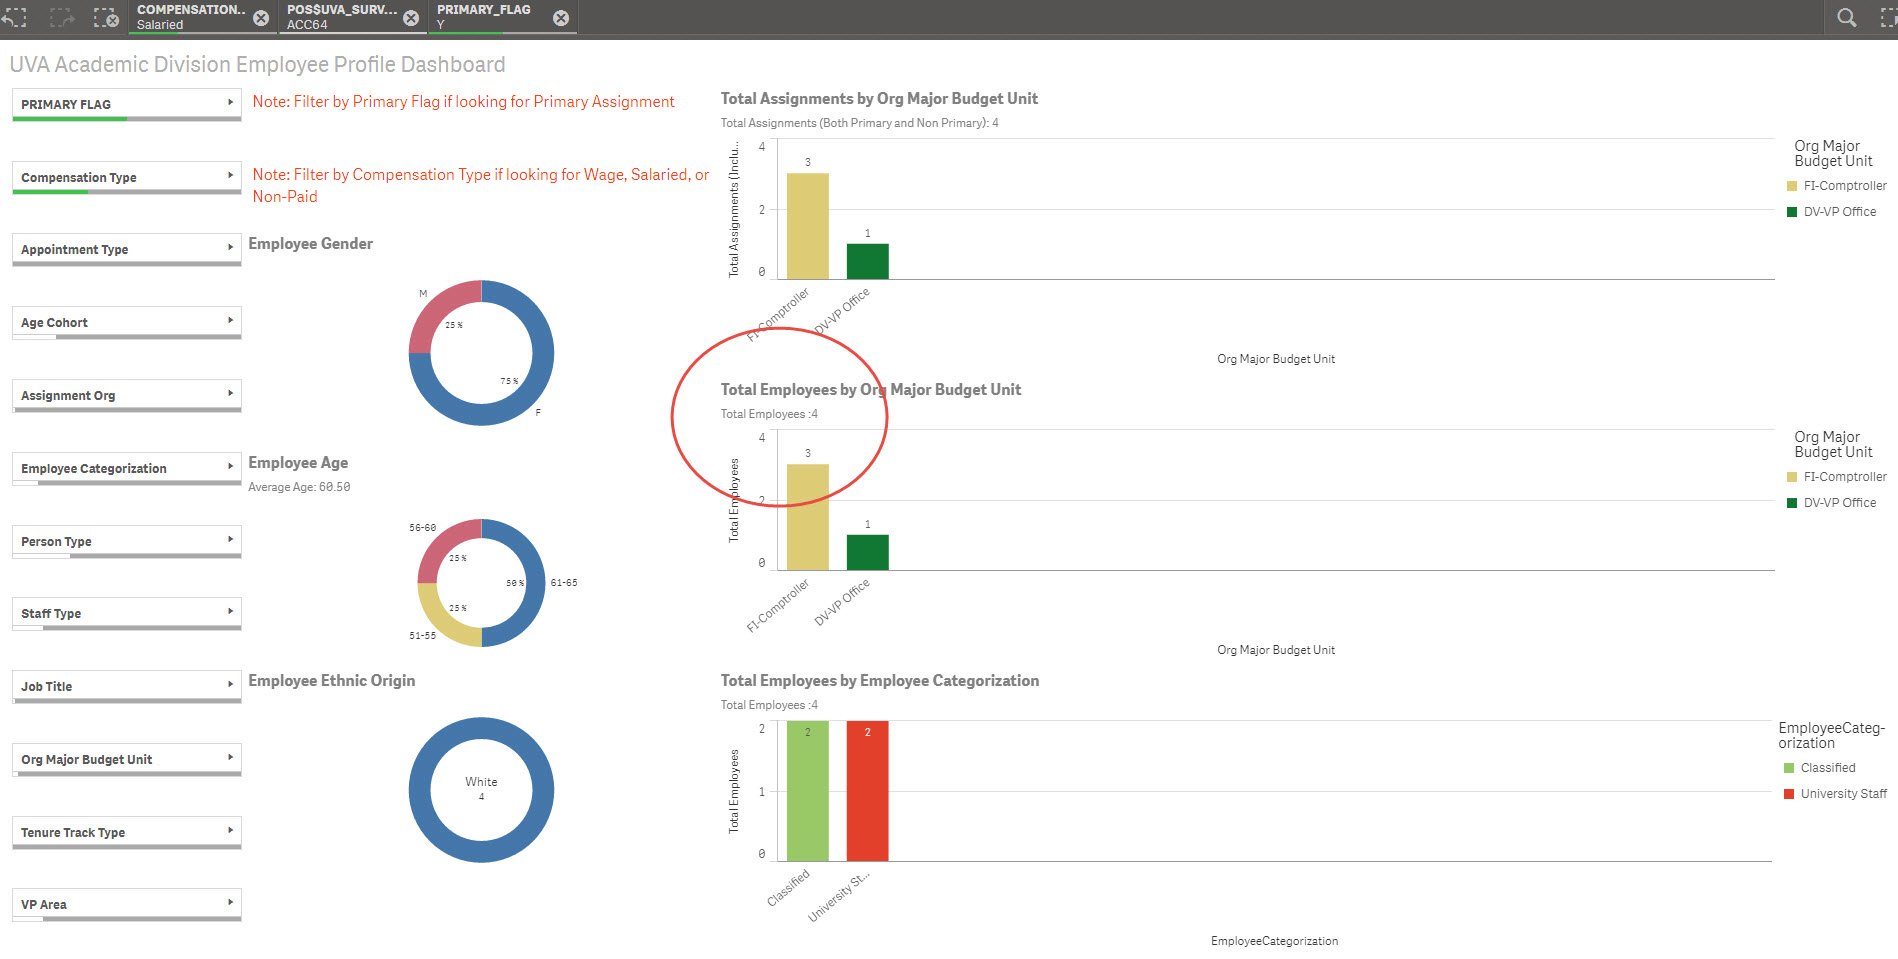
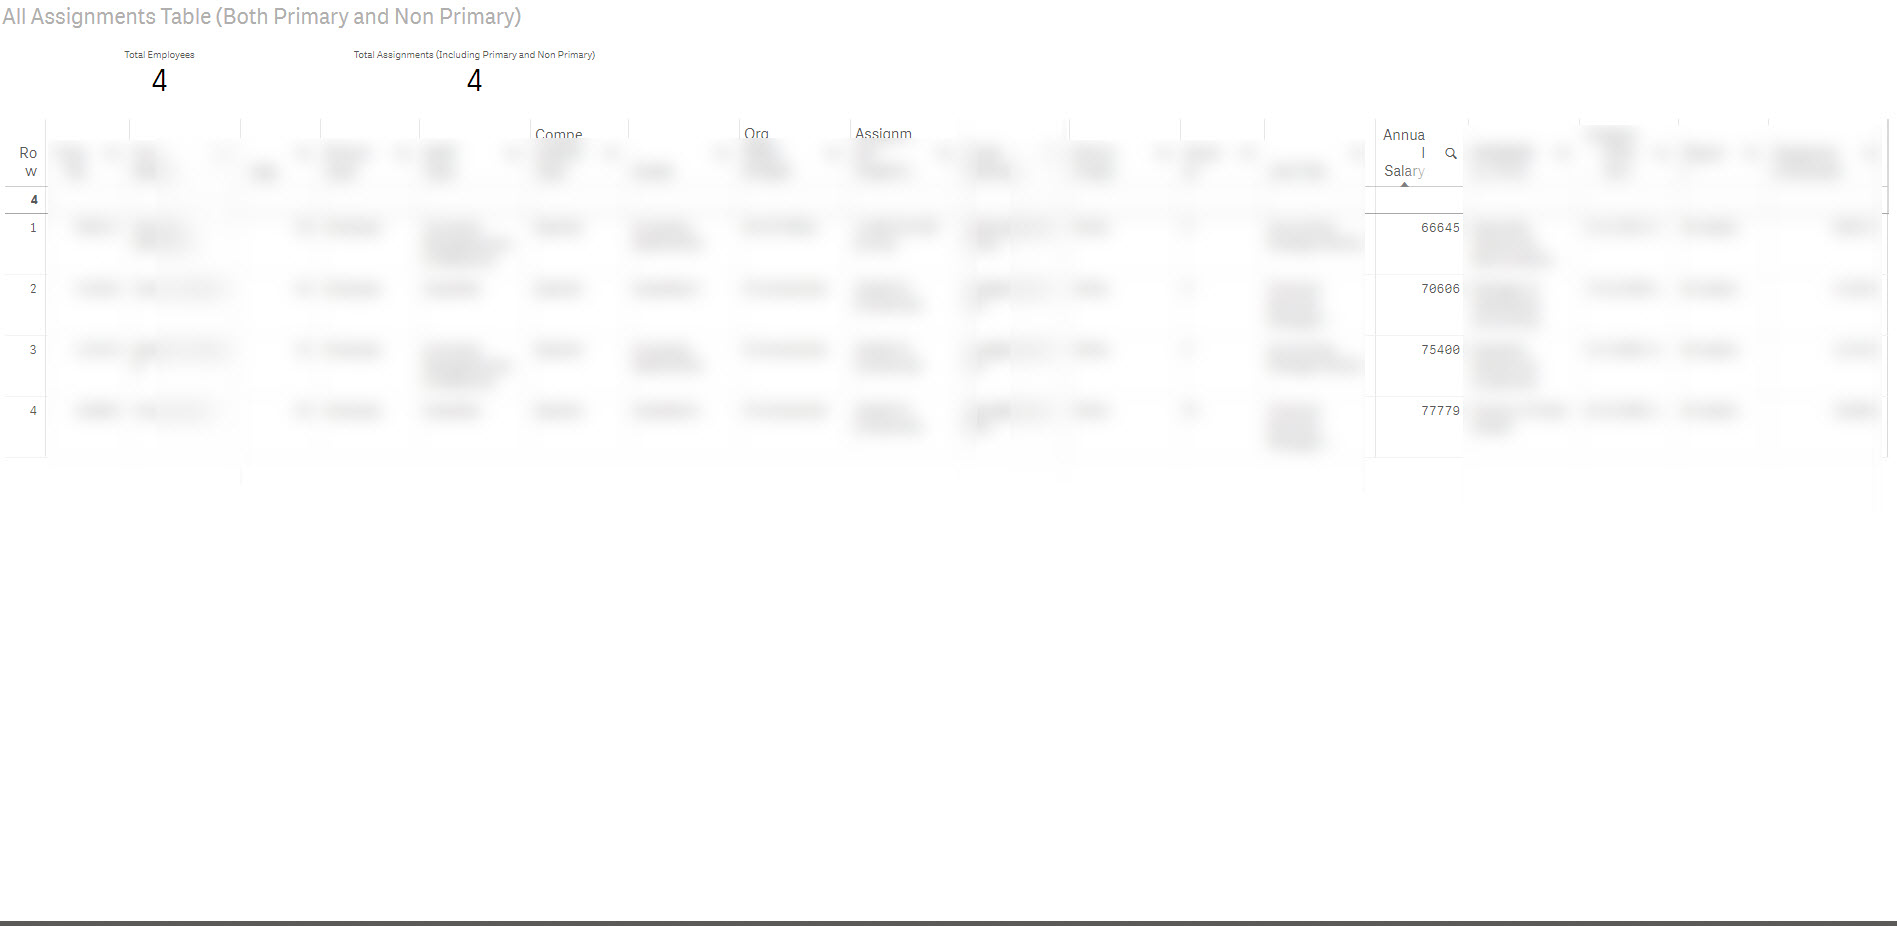
I have an app that contains two sheets. The first sheet is made up of visualizations and filters, and the second page is a table which contains every dimension (no measures or calculations).
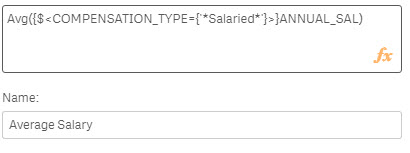
I select my desired filters, and then confirm the total amount of rows on the second sheet's table (it correctly matches the total counts from the first page). One column in this table is annual_salary. If I use the average function (annual_salary), I receive a number that does not match excel's average function on the same column.
Note:
1. The table is set to display all null values.
2. The column does not contain any 0's, or nulls.
Has anyone encountered similar issues with the avg function?
- Tags:
- avg(expr)
Accepted Solutions
- Mark as New
- Bookmark
- Subscribe
- Mute
- Subscribe to RSS Feed
- Permalink
- Report Inappropriate Content
How about this:
Avg(Aggr(Only({<COMPENSATION_TYPE = {'*Salaried*'}>} ANNUAL_SAL), Employee_ID))
- Mark as New
- Bookmark
- Subscribe
- Mute
- Subscribe to RSS Feed
- Permalink
- Report Inappropriate Content
Looking here might help:
- Mark as New
- Bookmark
- Subscribe
- Mute
- Subscribe to RSS Feed
- Permalink
- Report Inappropriate Content
Chris,
I would double check the raw data. The average function will calculate over the number of table rows.
Nulls are also discarded from the calculation. for example:
Column:
[2
3
4
null]
Result from the average function would be 3.
zero values should be included. You check method looks valid and I would expect a match. Just double check your work.
Mike
- Mark as New
- Bookmark
- Subscribe
- Mute
- Subscribe to RSS Feed
- Permalink
- Report Inappropriate Content
What do you mean with
'(it correctly matches the total counts from the first page)'?
What is exactely shown at both places?
Note that e.g. a table box on second sheet won't show every record, only distinct combinations of dimensional values.
- Mark as New
- Bookmark
- Subscribe
- Mute
- Subscribe to RSS Feed
- Permalink
- Report Inappropriate Content
Please screen shots below. In the second screen shot, I see an average salary of 72,457. If you average the salaries listed in the 4th screen shot, that is not the true average.

- Mark as New
- Bookmark
- Subscribe
- Mute
- Subscribe to RSS Feed
- Permalink
- Report Inappropriate Content
How about this:
Avg(Aggr(Only({<COMPENSATION_TYPE = {'*Salaried*'}>} ANNUAL_SAL), Employee_ID))
- Mark as New
- Bookmark
- Subscribe
- Mute
- Subscribe to RSS Feed
- Permalink
- Report Inappropriate Content
Yessssss, thank you, that did it.
You are my hero. You all need an online tip jar, you just saved me a ton of headache.
Thanks again,
Chris
- Mark as New
- Bookmark
- Subscribe
- Mute
- Subscribe to RSS Feed
- Permalink
- Report Inappropriate Content
Great 
Please close this thread by marking correct and helpful responses, if you got what you were looking for.
Qlik Community Tip: Marking Replies as Correct or Helpful
Best,
Sunny
- Mark as New
- Bookmark
- Subscribe
- Mute
- Subscribe to RSS Feed
- Permalink
- Report Inappropriate Content
The data set hasDeptName, EmpName column and the TAT(Turn around Time in Hrs) columns, we are calculating the Min.TAT, Max.TAT and the Avg.TAT
Avg(TAT) function or Sum(TAT)/Count(TAT)
Both are giving results that are incorrect when I calculate manually.
Can you please throw some light on this.
Thanks,
Vijay