Unlock a world of possibilities! Login now and discover the exclusive benefits awaiting you.

- Qlik Community
- :
- Forums
- :
- Analytics & AI
- :
- Products & Topics
- :
- Visualization and Usability
- :
- Re: Bar chart
- Subscribe to RSS Feed
- Mark Topic as New
- Mark Topic as Read
- Float this Topic for Current User
- Bookmark
- Subscribe
- Mute
- Printer Friendly Page

 ValeriaBonini
- Mark as New
- Bookmark
- Subscribe
- Mute
- Subscribe to RSS Feed
- Permalink
- Report Inappropriate Content
Bar chart
Hi everybody, i would like to create a barchart like the one below:
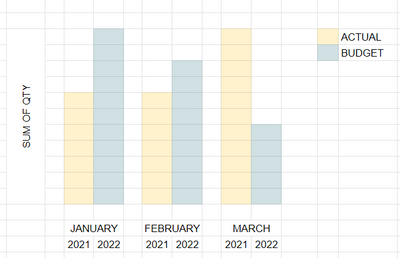
In my script i have the sum of qty sold for actual and budget (TOTAL_ACTUAL and TOTAL_BUDGET) and the MONTH and YEAR fields.
How can I create a barchart grouped like this?
Accepted Solutions

 SchalkF
- Mark as New
- Bookmark
- Subscribe
- Mute
- Subscribe to RSS Feed
- Permalink
- Report Inappropriate Content
Good day,
If I understand your question correctly you are looking for something like this:
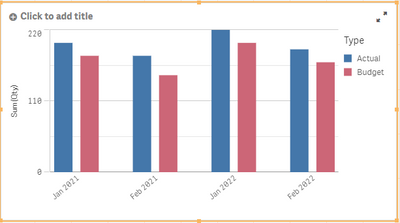
The below is my data load which sounds similar to what you currently have:
Table:
load *
inline [
Year,Month,Type,Qty
2021,01,Actual,200
2021,01,Budget,180
2022,01,Actual,220
2022,01,Budget,200
2021,02,Actual,180
2021,02,Budget,150
2022,02,Actual,190
2022,02,Budget,170
]
(delimiter is ',');
My Dimensions/Measures are as follows:
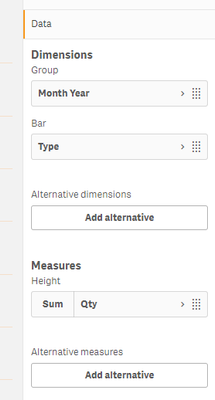
Where Month Year is basically just a concatenate in the Dimension expression as below:
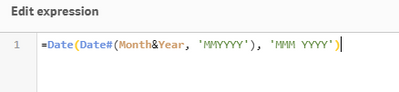
Kind regards
SchalkF
- Mark as New
- Bookmark
- Subscribe
- Mute
- Subscribe to RSS Feed
- Permalink
- Report Inappropriate Content
Good day,
If I understand your question correctly you are looking for something like this:
The below is my data load which sounds similar to what you currently have:
Table:
load *
inline [
Year,Month,Type,Qty
2021,01,Actual,200
2021,01,Budget,180
2022,01,Actual,220
2022,01,Budget,200
2021,02,Actual,180
2021,02,Budget,150
2022,02,Actual,190
2022,02,Budget,170
]
(delimiter is ',');
My Dimensions/Measures are as follows:
Where Month Year is basically just a concatenate in the Dimension expression as below:
Kind regards
