Unlock a world of possibilities! Login now and discover the exclusive benefits awaiting you.
- Qlik Community
- :
- Forums
- :
- Analytics & AI
- :
- Products & Topics
- :
- Visualization and Usability
- :
- Calculate Difference in Rows in Pivot
- Subscribe to RSS Feed
- Mark Topic as New
- Mark Topic as Read
- Float this Topic for Current User
- Bookmark
- Subscribe
- Mute
- Printer Friendly Page
- Mark as New
- Bookmark
- Subscribe
- Mute
- Subscribe to RSS Feed
- Permalink
- Report Inappropriate Content
Calculate Difference in Rows in Pivot
Hello,
I have a pivot table in Qlik Sense for which I want to see how the measures changed from one year to another.
In the rows I have customer name and the year (2016&2017) and in the measures i have several sums or other calculations. I would like to see the difference between years as well. The table looks something like this:
| Customer | Year | Sales | Cost |
| Customer A | 2016 | 100 | 60 |
| 2017 | 150 | 80 | |
| Difference | 50 | 20 |
What is the best way to do this?
Thanks,
Radu
- Mark as New
- Bookmark
- Subscribe
- Mute
- Subscribe to RSS Feed
- Permalink
- Report Inappropriate Content
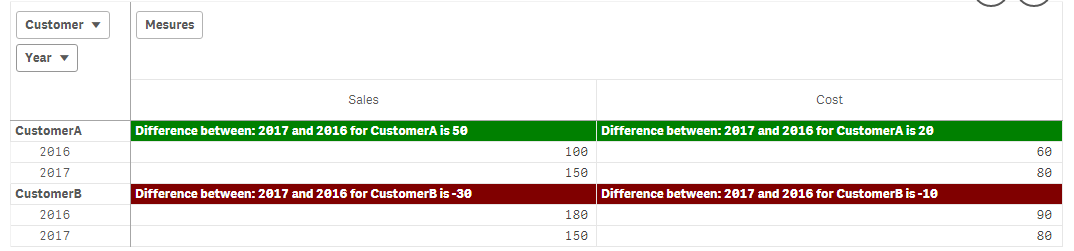
SUPPOSE U HAVE THIS:
tab:
load * Inline [
Customer, Year, Sales, Cost
CustomerA, 2016, 100,60
CustomerA, 2017, 150,80
CustomerB, 2016, 180,90
CustomerB, 2017, 150,80
];
Create a pivot table:
as dimension: Customer
Add line : Year
as measure1:
if(Dimensionality()=1, 'Difference between: '&max(Year)&' and '&(max(Year)-1)&' for '&Customer &' is ' &(sum({<Year={"$(=max(Year))"}>}Sales)-sum({<Year={"$(=max(Year)-1)"}>}Sales)),
Sum(Sales))
color it by expression :
if(Dimensionality()<>1,White(), if(Dimensionality()=1 and (sum({<Year={"$(=max(Year))"}>}Sales)-sum({<Year={"$(=max(Year)-1)"}>}Sales)) >0,
Green(), red()))
as Measure2:
if(Dimensionality()=1, 'Difference between: '&max(Year)&' and '&(max(Year)-1)&' for '&Customer &' is ' &(sum({<Year={"$(=max(Year))"}>}Cost)-sum({<Year={"$(=max(Year)-1)"}>}Cost)),
Sum(Cost))
Color it by expression :
if(Dimensionality()<>1,White(), if(Dimensionality()=1 and (sum({<Year={"$(=max(Year))"}>}Cost)-sum({<Year={"$(=max(Year)-1)"}>}Cost)) >0,
Green(), red()))
result: