Unlock a world of possibilities! Login now and discover the exclusive benefits awaiting you.

- Qlik Community
- :
- Forums
- :
- Analytics & AI
- :
- Products & Topics
- :
- Visualization and Usability
- :
- Calculated dimensions as set modifiers
- Subscribe to RSS Feed
- Mark Topic as New
- Mark Topic as Read
- Float this Topic for Current User
- Bookmark
- Subscribe
- Mute
- Printer Friendly Page

 liviumac
- Mark as New
- Bookmark
- Subscribe
- Mute
- Subscribe to RSS Feed
- Permalink
- Report Inappropriate Content
Calculated dimensions as set modifiers
Hello
I hope I'll be able to explain what I want to achieve, so here it goes:
1. database fields: reporting_date, client, numerical_attribute, sales
2. calculated dimension: for any 2 selected dates, if the numerical attribute of the client has increased, I define a new category named, let's say, "UP", if it has decreased then its "DOWN", stayed the same is "NO CHG"
since I want to be able to calculated this dimension for any 2 reporting dates upon making a selection, I use in the dimension as set modifiers 2 variables based on the reporting date selected (one variable calculates the largest date and the other the smaller date)
so basically my dimension calculates, for any 2 selected reporting dates and for each client, whether the numerical attribute has increased or decreased and assigns to the client either an UP or a DOWN or a NO CHG
I cannot implement this in the script because whether the client is included in UP/DOWN/NO CHG depends on what 2 dates are compared, i.e. the same client can be in eg UP when 2 dates are selected and it can be in eg DOWN when another 2 dates are selected
3. what I want to do is calculate total sales (or increase in sales, it doesn't matter) for the clients which, for 2 dates, are in the UP category and only in this category (or in the DOWN etc, but only for that category)
if the dimension I calculate was a field, I would use a normal modifier sum({<dimension={'UP'}>}sales)
but if instead of "dimension" I write the formula for the dimension, it does not work
if I put the calculated dimension in a table, it works, but I need the value only for each category at a time (for a waterfall chart)
- « Previous Replies
-
- 1
- 2
- Next Replies »
Accepted Solutions

 OmarBenSalem
- Mark as New
- Bookmark
- Subscribe
- Mute
- Subscribe to RSS Feed
- Permalink
- Report Inappropriate Content
Example (per analogy)
Hope it would help u :
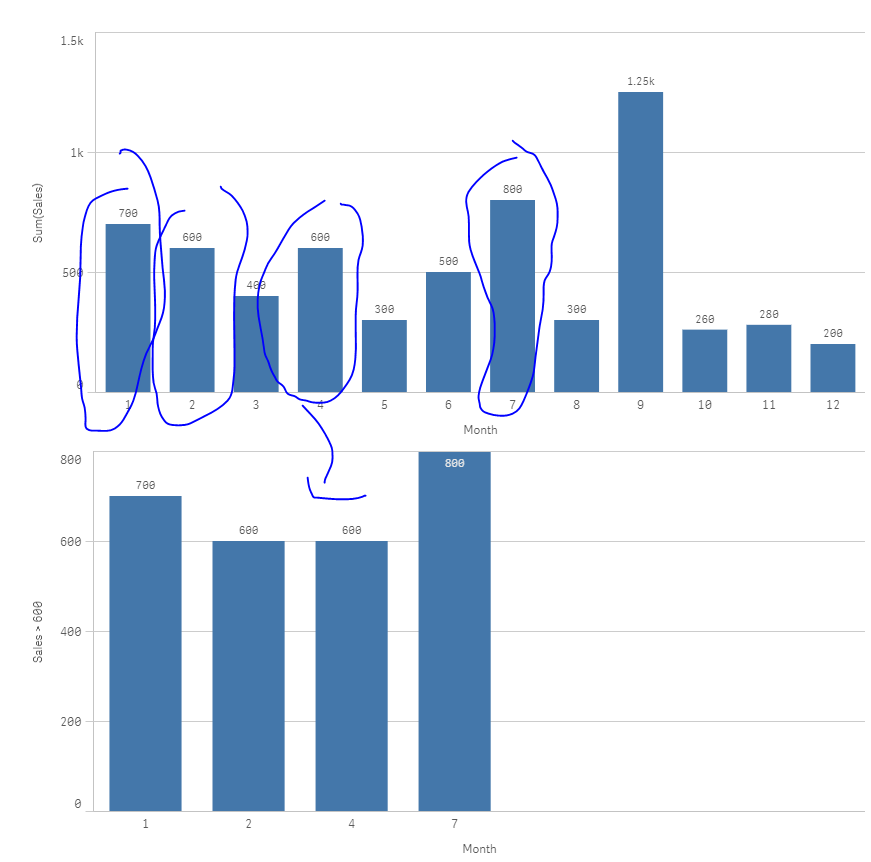
Let's assume I have a bar chart as follow:
Dimension : Month
Measure: sum(Sales)
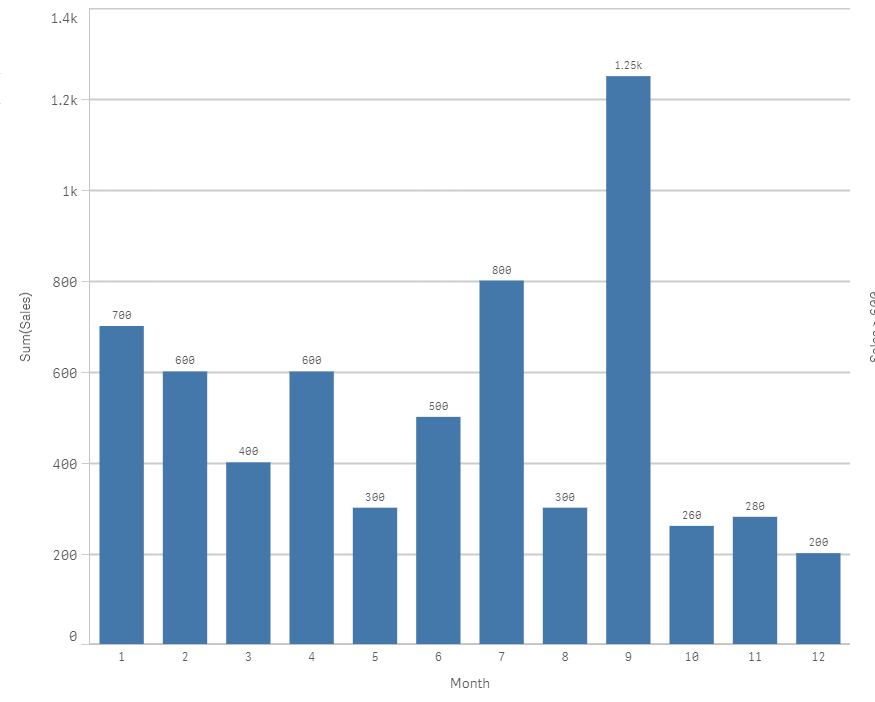
As u can see, there is Sales >600 and others <600; what I want to do is create a new dimension which will have 2 values : Sales > 600 and Sales < 600
=> Let's create this calculated dimension :
=aggr(if(sum(Sales)>600,'Sales >600','Sales <600'),Month)
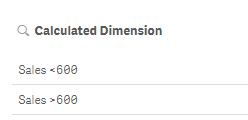
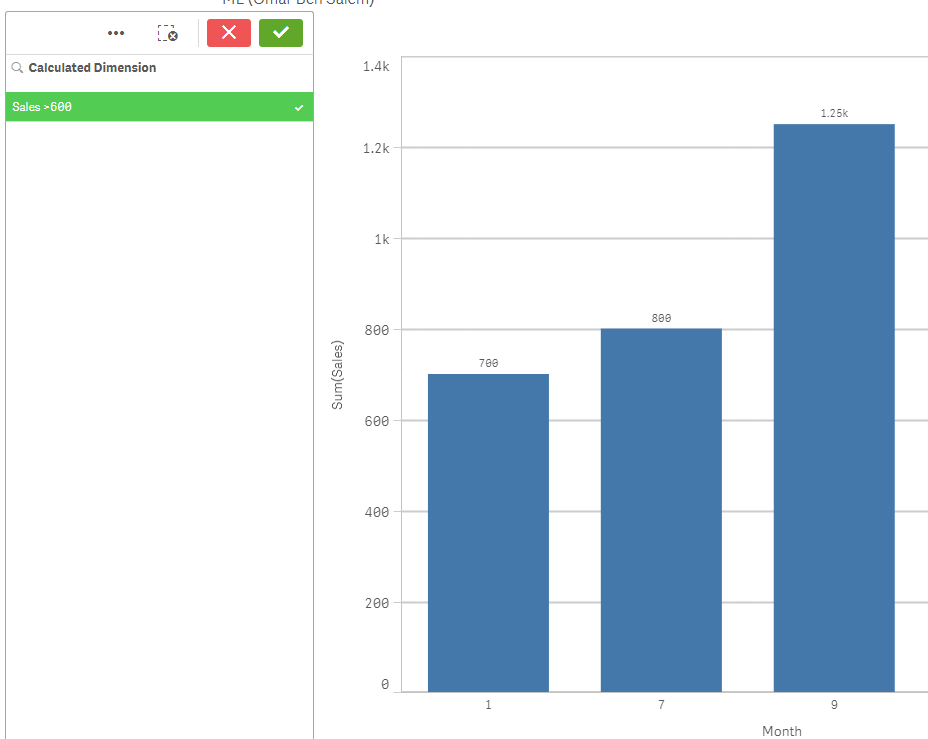
So when I click on Sales >600; I 'll only keep the Month that Have sales > 600 :
Now, what if I wanted to write this directly in the expression of the bar chart; and introduce this newly calculated value Sales > 600 in the set analysis..
Well we can't do it.. BUT we can reconstruct it like follow:
In the bar chart: change the measure
From
sum(Sales)
to
Sum({<Month={"=sum(Sales)>600"}>}Sales)
Result( without any selection):
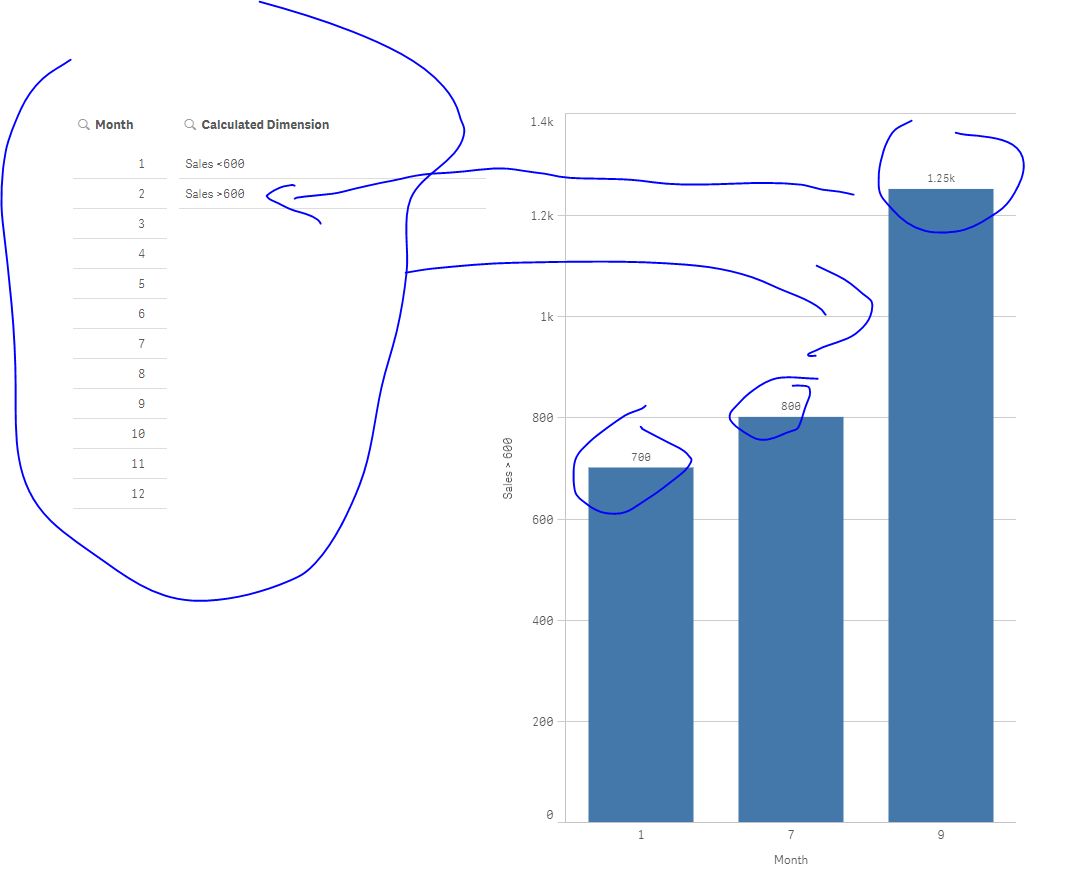
Hope u can replcate this logic and it could thus help u!
Omar BEN SALEM
OmarBenSalem
- Mark as New
- Bookmark
- Subscribe
- Mute
- Subscribe to RSS Feed
- Permalink
- Report Inappropriate Content
Can u give an example on how u calculate ur new dimension?
liviumac
- Mark as New
- Bookmark
- Subscribe
- Mute
- Subscribe to RSS Feed
- Permalink
- Report Inappropriate Content
this is the approximate formula (not sure if the syntax is 100% correct because my original formula is more complicated because some clients are new or missing so I need to treat those cases as well etc)
=aggr(if(avg({<reporting_date={'$(=vMaxDat)'}>}numerical_attribute)-avg({<reporting_date={'$(=vMinDat)'}>}numerical_attribute)=0, 'NO CHG', if(avg({<reporting_date={'$(=vMaxDat)'}>}numerical_attribute)-avg({<reporting_date={'$(=vMinDat)'}>}numerical_attribute)>0,'UP','DOWN')),client)
vMaxDat and vMinDat are the variables that calculate the largest and the smallest date of the 2 dates selected
OmarBenSalem
- Mark as New
- Bookmark
- Subscribe
- Mute
- Subscribe to RSS Feed
- Permalink
- Report Inappropriate Content
Example (per analogy)
Hope it would help u :
Let's assume I have a bar chart as follow:
Dimension : Month
Measure: sum(Sales)
As u can see, there is Sales >600 and others <600; what I want to do is create a new dimension which will have 2 values : Sales > 600 and Sales < 600
=> Let's create this calculated dimension :
=aggr(if(sum(Sales)>600,'Sales >600','Sales <600'),Month)
So when I click on Sales >600; I 'll only keep the Month that Have sales > 600 :
Now, what if I wanted to write this directly in the expression of the bar chart; and introduce this newly calculated value Sales > 600 in the set analysis..
Well we can't do it.. BUT we can reconstruct it like follow:
In the bar chart: change the measure
From
sum(Sales)
to
Sum({<Month={"=sum(Sales)>600"}>}Sales)
Result( without any selection):
Hope u can replcate this logic and it could thus help u!
Omar BEN SALEM
liviumac
- Mark as New
- Bookmark
- Subscribe
- Mute
- Subscribe to RSS Feed
- Permalink
- Report Inappropriate Content
it absolutely worked ! (after some trials and tweaks)
OMG Qlik is awesome!
thank you very much for your help!
OmarBenSalem
- Mark as New
- Bookmark
- Subscribe
- Mute
- Subscribe to RSS Feed
- Permalink
- Report Inappropriate Content
I confirm; Qlik is awesome 
ps: my pleasure.
liviumac
- Mark as New
- Bookmark
- Subscribe
- Mute
- Subscribe to RSS Feed
- Permalink
- Report Inappropriate Content
one more question please
what if in your example I would create 3 categories instead of 2 (let's say 300, 600 and above 600) and I wanted to calculate for 2 of them, let's say < 300 AND 300<X<600 ?
what would this bit <Month={"=sum(Sales)>600"}> look like?
hope I'm not pushing it  )
)
OmarBenSalem
- Mark as New
- Bookmark
- Subscribe
- Mute
- Subscribe to RSS Feed
- Permalink
- Report Inappropriate Content
Not at all : sales >=600 and <=800
Sum({<Month={"=sum(Sales)>=600 and sum(Sales)<=800"}>}Sales)
result:
liviumac
- Mark as New
- Bookmark
- Subscribe
- Mute
- Subscribe to RSS Feed
- Permalink
- Report Inappropriate Content
thank you
liviumac
- Mark as New
- Bookmark
- Subscribe
- Mute
- Subscribe to RSS Feed
- Permalink
- Report Inappropriate Content
I have one more question today:
since the formulas can become very long, I thought of using a variable to calculate my dimension
the problem is that I do not know what is the syntax when the calculated dimension is a variable
more specifically, how would this
Month={"=sum(Sales)>600"}
look if sum(Sales) was a variable named, let's say vSales?
I have tried Month={"=$(=vSales)>600"}
and variations of the like but cannot get it to work
thank you

- « Previous Replies
-
- 1
- 2
- Next Replies »