Unlock a world of possibilities! Login now and discover the exclusive benefits awaiting you.
- Qlik Community
- :
- Forums
- :
- Analytics & AI
- :
- Products & Topics
- :
- Visualization and Usability
- :
- Re: Changing color of each stack for measure in wh...
- Subscribe to RSS Feed
- Mark Topic as New
- Mark Topic as Read
- Float this Topic for Current User
- Bookmark
- Subscribe
- Mute
- Printer Friendly Page
- Mark as New
- Bookmark
- Subscribe
- Mute
- Subscribe to RSS Feed
- Permalink
- Report Inappropriate Content
Changing color of each stack for measure in which set analysis was used
Hi all,
I have a stacked Bar Chart for my data across regions like this
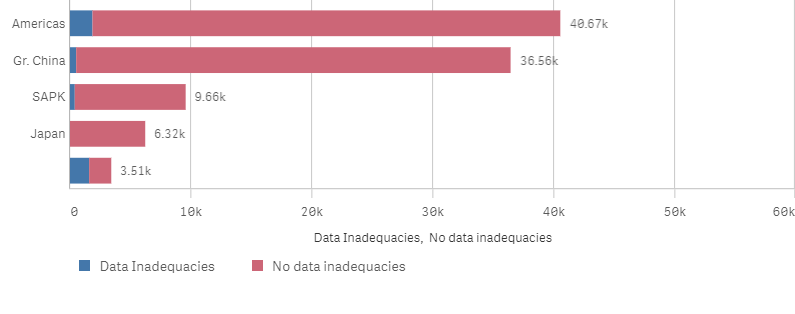
I want to be able to change the color of the 'data inadequacies' stack to Red and ' No data inadequacies' stack to green.
I have made the data inaedquacies measure using the formula -
Count({$<[District missing] = {"District missing)"}>
+ <[PostalCode missing]={'PostalCode missing'}>
+ <[State missing]={'State missing'}>
+ <[Country missing]={'Country missing'}>
+ <[MapPoint missing]={'MapPoint missing'}>
}Region)
in Fx function under measure
and similarly for data adequacies as well.
How do I change the color of each stack then?
pick(match(Region,'Data Inadequacies','No data inadequacies'),red(),Green()) didnt work it just turned grey
Any help is appreciated!
- Mark as New
- Bookmark
- Subscribe
- Mute
- Subscribe to RSS Feed
- Permalink
- Report Inappropriate Content
Try this
Pick(Match(Only({1} Region),'Data Inadequacies','No data inadequacies'), Red(), Green())
- Mark as New
- Bookmark
- Subscribe
- Mute
- Subscribe to RSS Feed
- Permalink
- Report Inappropriate Content
Thanks Sunny
but it still remains Grey
- Mark as New
- Bookmark
- Subscribe
- Mute
- Subscribe to RSS Feed
- Permalink
- Report Inappropriate Content

- Mark as New
- Bookmark
- Subscribe
- Mute
- Subscribe to RSS Feed
- Permalink
- Report Inappropriate Content
Thank you! This helped!