Unlock a world of possibilities! Login now and discover the exclusive benefits awaiting you.
Announcements
Talend Cloud AWS EU Scheduled Outage: Starting Tues 26 May 21:00 CEST with expected completion Wed 27 May 01:00 CEST
- Qlik Community
- :
- Forums
- :
- Analytics & AI
- :
- Products & Topics
- :
- Visualization and Usability
- :
- Re: Chart clustering by month
Options
- Subscribe to RSS Feed
- Mark Topic as New
- Mark Topic as Read
- Float this Topic for Current User
- Bookmark
- Subscribe
- Mute
- Printer Friendly Page
Turn on suggestions
Auto-suggest helps you quickly narrow down your search results by suggesting possible matches as you type.
Showing results for
Anonymous
Not applicable
2016-08-19
04:21 AM
- Mark as New
- Bookmark
- Subscribe
- Mute
- Subscribe to RSS Feed
- Permalink
- Report Inappropriate Content
Chart clustering by month
Hi Guys,
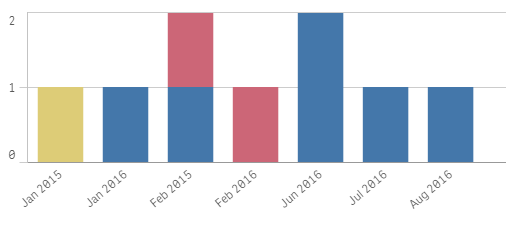
Is there any way to cluster the bar chart by month ? I want to make the jan 2015 & jan 2016 side by side.
Then, between jan 2016 & feb 2015, there should be gap as it is different month. Kindly help. Thanks.
868 Views
2 Replies
Anonymous
Not applicable
2016-08-19
05:50 AM
Author
- Mark as New
- Bookmark
- Subscribe
- Mute
- Subscribe to RSS Feed
- Permalink
- Report Inappropriate Content
!Hi Ahmad,
If you generate a field with MonthYear together and put it as dimension to your barchart then it will work (of course sorting by monthyear). Use the atteched file.
HIH
Elena
781 Views
Partner - Contributor III
2016-08-19
06:46 AM
- Mark as New
- Bookmark
- Subscribe
- Mute
- Subscribe to RSS Feed
- Permalink
- Report Inappropriate Content
Hi Ahmad,
a simple way to do this is creating two measures:
- Sum({$<Year={2014}>}Value)
- Sum({$<Year={2015}>}Value)
with a unique dimension: month
I have used the Elena's file to apply the modifications.
781 Views