Unlock a world of possibilities! Login now and discover the exclusive benefits awaiting you.
- Qlik Community
- :
- Forums
- :
- Analytics & AI
- :
- Products & Topics
- :
- Visualization and Usability
- :
- Container
- Subscribe to RSS Feed
- Mark Topic as New
- Mark Topic as Read
- Float this Topic for Current User
- Bookmark
- Subscribe
- Mute
- Printer Friendly Page
- Mark as New
- Bookmark
- Subscribe
- Mute
- Subscribe to RSS Feed
- Permalink
- Report Inappropriate Content
Container
Hello ,
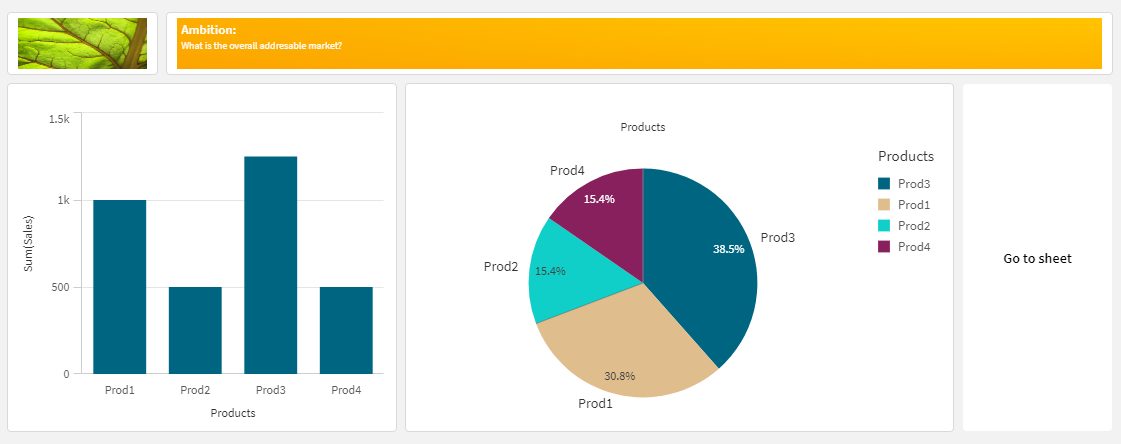
I want to define the first sheet of the application as the home page, which I want to present key KPIs and add buttons that will take us back to the sheet where there are more details.
I want to present containers (as in the pj) and put the graph, a question and the button there and that it is not in tabs, is it possible?
Thank you

Accepted Solutions
- Mark as New
- Bookmark
- Subscribe
- Mute
- Subscribe to RSS Feed
- Permalink
- Report Inappropriate Content
Hello,
The exact use case scenario might not be 100% achievable, since it is a very specific representation. Here are some details on how you can try getting as closer as possible:
1. The native container, only allows you to have one singe Chart object and if you add multiple ones, then you will have to use the tabs to view them. However, this is not what you are looking for, as far as I understand based on your description.
2. You can try using other custom extensions that were developed by other developers. Extensions like: Climber Container [1] or Grouped Container [2]. The description states that you can combine multiple objects, however in case you have difficulties or issues while implementing your solution, then you will have to contact directly the developers of the extensions.
3. You can try just using different native elements to construct your UI such as:
a. Text & image objects (To add icon, background image with text, question etc.)
b. Your charts
c. Your button
4. If you would like to get rid of the gaps between the charts, you can use customer theme [3], which will allow you to change the chart's background and making it as the entire sheet has one color.
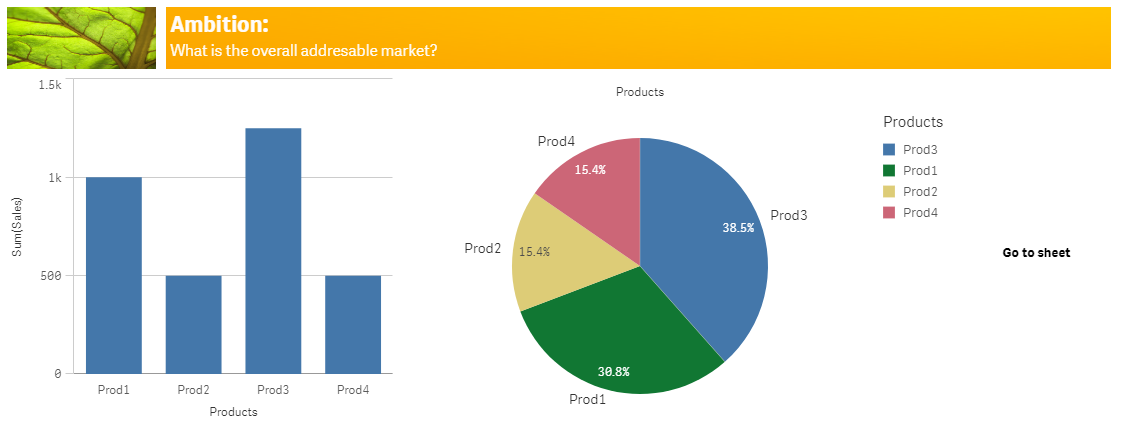
5. If you would like to make it look even better, then you will have to play around with Photoshop, to make the background image blend with transparency or the background color, so it will not look so sharp on the edges. But to have a great result, you will have to have good Photoshop skills or/and spend some time modifying the image.
6. If you would like to have it natively available, then you can submit a feature request [4].
I hope that this information was helpful. In case I have misunderstood the use case scenario, please elaborate in details by providing additional information. However, if it has helped you resolve the issue, please mark it as accepted solution to give further visibility to other community members.
---
[1] https://developer.qlik.com/garden/5a96b35a06336278f452ea35
[2] https://developer.qlik.com/garden/5fd3acb6dae7960011eb30ca
- Mark as New
- Bookmark
- Subscribe
- Mute
- Subscribe to RSS Feed
- Permalink
- Report Inappropriate Content
Hello,
The exact use case scenario might not be 100% achievable, since it is a very specific representation. Here are some details on how you can try getting as closer as possible:
1. The native container, only allows you to have one singe Chart object and if you add multiple ones, then you will have to use the tabs to view them. However, this is not what you are looking for, as far as I understand based on your description.
2. You can try using other custom extensions that were developed by other developers. Extensions like: Climber Container [1] or Grouped Container [2]. The description states that you can combine multiple objects, however in case you have difficulties or issues while implementing your solution, then you will have to contact directly the developers of the extensions.
3. You can try just using different native elements to construct your UI such as:
a. Text & image objects (To add icon, background image with text, question etc.)
b. Your charts
c. Your button
4. If you would like to get rid of the gaps between the charts, you can use customer theme [3], which will allow you to change the chart's background and making it as the entire sheet has one color.
5. If you would like to make it look even better, then you will have to play around with Photoshop, to make the background image blend with transparency or the background color, so it will not look so sharp on the edges. But to have a great result, you will have to have good Photoshop skills or/and spend some time modifying the image.
6. If you would like to have it natively available, then you can submit a feature request [4].
I hope that this information was helpful. In case I have misunderstood the use case scenario, please elaborate in details by providing additional information. However, if it has helped you resolve the issue, please mark it as accepted solution to give further visibility to other community members.
---
[1] https://developer.qlik.com/garden/5a96b35a06336278f452ea35
[2] https://developer.qlik.com/garden/5fd3acb6dae7960011eb30ca
- Mark as New
- Bookmark
- Subscribe
- Mute
- Subscribe to RSS Feed
- Permalink
- Report Inappropriate Content
Hello ,
I used lQlik Mashup to develop the container with all the object and call it in the Qlik sheet and it works very well.
thank you for the answer