Unlock a world of possibilities! Login now and discover the exclusive benefits awaiting you.

- Qlik Community
- :
- Forums
- :
- Analytics & AI
- :
- Products & Topics
- :
- Visualization and Usability
- :
- Count items group by name based on status
- Subscribe to RSS Feed
- Mark Topic as New
- Mark Topic as Read
- Float this Topic for Current User
- Bookmark
- Subscribe
- Mute
- Printer Friendly Page

- Mark as New
- Bookmark
- Subscribe
- Mute
- Subscribe to RSS Feed
- Permalink
- Report Inappropriate Content
Count items group by name based on status
Hi,
I have a table of items with status 'Missing' or 'Installed'. Simplified table below:
| Name | Status |
|---|---|
| A | Missing |
| B | Installed |
| B | Installed |
| C | Missing |
| C | Installed |
How can I achieve this calculation of total installed and missing items?
| Name | Total | Installed | Missing |
|---|---|---|---|
| A | 1 | 0 | 1 |
| B | 2 | 2 | 0 |
| C | 2 | 1 | 1 |
I managed to get the correct numbers but am not able to display it in the way I want to (as above) with the following codes
hostnameTotals:
Load "Host Name",
count(distinct %PWID) as "PW.Total"
Resident tempTable
group by "Host Name";
hostnameInstalled:
Load "Host Name",
if([PW.Status] like 'Installed', count(distinct %PWID)) as "PW.Installed",
if([PW.Status] like 'Missing', count(distinct %PWID)) as "PW.Missing"
Resident tempTable
group by "Host Name", [PW.Status];
Accepted Solutions

 OmarBenSalem
- Mark as New
- Bookmark
- Subscribe
- Mute
- Subscribe to RSS Feed
- Permalink
- Report Inappropriate Content
Don't alter ur source;
juste in your sheet, create a pivot table:
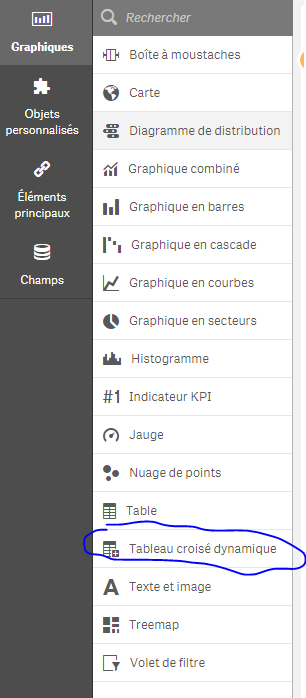
As a dimension: Name
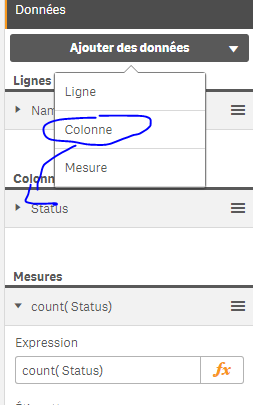
As a measure: count(Status) or count(Distinct Status) ; depends on what u want to show
then add a column : Status
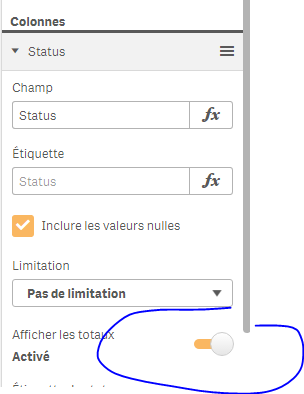
Lastly, activate the totals on the Status column:
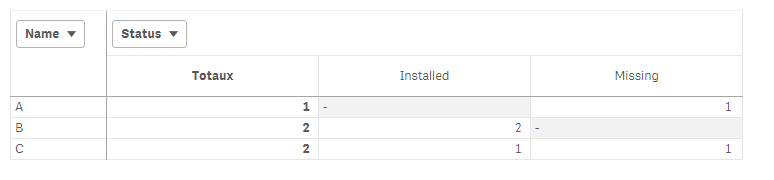
result:
OmarBenSalem
- Mark as New
- Bookmark
- Subscribe
- Mute
- Subscribe to RSS Feed
- Permalink
- Report Inappropriate Content
Don't alter ur source;
juste in your sheet, create a pivot table:
As a dimension: Name
As a measure: count(Status) or count(Distinct Status) ; depends on what u want to show
then add a column : Status
Lastly, activate the totals on the Status column:
result:
- Mark as New
- Bookmark
- Subscribe
- Mute
- Subscribe to RSS Feed
- Permalink
- Report Inappropriate Content
was thinking too much and didn't think of using a pivot table haha thank you!! 
Best Regards
Serena
- Mark as New
- Bookmark
- Subscribe
- Mute
- Subscribe to RSS Feed
- Permalink
- Report Inappropriate Content
What if I want to calculate Installed/Totals? Can I do this in the pivot table?
OmarBenSalem
- Mark as New
- Bookmark
- Subscribe
- Mute
- Subscribe to RSS Feed
- Permalink
- Report Inappropriate Content
can you maybe show me with an image how u want to show this?
- Mark as New
- Bookmark
- Subscribe
- Mute
- Subscribe to RSS Feed
- Permalink
- Report Inappropriate Content
Example:
| Name | Totals | Installed | Missing | Compliance % |
|---|---|---|---|---|
| A | 1 | 0 | 1 | 0 (0/1*100) |
| B | 2 | 2 | 0 | 100 (2/2*100) |
| C | 2 | 1 | 1 | 50 (1/2*100) |
Compliance % = Installed / Total * 100
OmarBenSalem
- Mark as New
- Bookmark
- Subscribe
- Mute
- Subscribe to RSS Feed
- Permalink
- Report Inappropriate Content
If u wanted to be exactly as follow:
u'll have to do like this (but then , you won't be able to filter this table by Status...)
So create a pivot table:
as Dimension: Name
As column: =ValueList('Totals','Installed','Missing','Compliance%')
As a measure:
if(ValueList('Totals','Installed','Missing','Compliance%')='Totals', num(count(Status),'# ##0'),
if(ValueList('Totals','Installed','Missing','Compliance%')='Installed', num(count({<Status={'Installed'}>}Status),'# ##0'),
if(ValueList('Totals','Installed','Missing','Compliance%')='Missing', num( count({<Status={'Missing'}>}Status),'# ##0') ,
if(ValueList('Totals','Installed','Missing','Compliance%')='Compliance%', num((count({<Status={'Installed'}>}Status)/Count({<Name=,Status>}Status)),'# ##0,00%')
))))
Result:

OmarBenSalem
- Mark as New
- Bookmark
- Subscribe
- Mute
- Subscribe to RSS Feed
- Permalink
- Report Inappropriate Content
Or you can have sthing like this:
as dimension : Name
as column: Status
as measures:
count( Status)
count(Status)/count(total <Name> Status)
and activate totals on the column Status:
result:
