Unlock a world of possibilities! Login now and discover the exclusive benefits awaiting you.

- Qlik Community
- :
- Forums
- :
- Analytics & AI
- :
- Products & Topics
- :
- Visualization and Usability
- :
- Re: Create multiple dimensions from a single field...
- Subscribe to RSS Feed
- Mark Topic as New
- Mark Topic as Read
- Float this Topic for Current User
- Bookmark
- Subscribe
- Mute
- Printer Friendly Page

- Mark as New
- Bookmark
- Subscribe
- Mute
- Subscribe to RSS Feed
- Permalink
- Report Inappropriate Content
Create multiple dimensions from a single field/column, one per value
I'm brand new to Qlik sense, and I'm trying to create a line chart based on data for 311 calls in Austin, TX. I loaded a spreadsheet which contains an issue type column to describe the nature of each call that was received (the type column is not freeform - each cell contains one value from a controlled set of possible values). I'm trying to create a line chart that shows the number of calls for each type, over time (each day, over a full year).
I think this means that I need a dimension for each value that exists in the "type" field, but I don't know how to that. I know one workaround would be to massage the data in excel (i.e. a pivot table or histograms with counts of individual "type" values across all dates), but I'm wondering if there is a way to handle this in Qlik itself. Can you create multiple dimensions from a single field, based on the field value?
Accepted Solutions
- Mark as New
- Bookmark
- Subscribe
- Mute
- Subscribe to RSS Feed
- Permalink
- Report Inappropriate Content
It sounds like you are looking for a line chart with two dimensions and one expression?
When setting up your line chart add your time dimension first, in your case this seems to be date, then add a second dimension of type and lastly add your expression as the count of calls.
You should end up with something like this
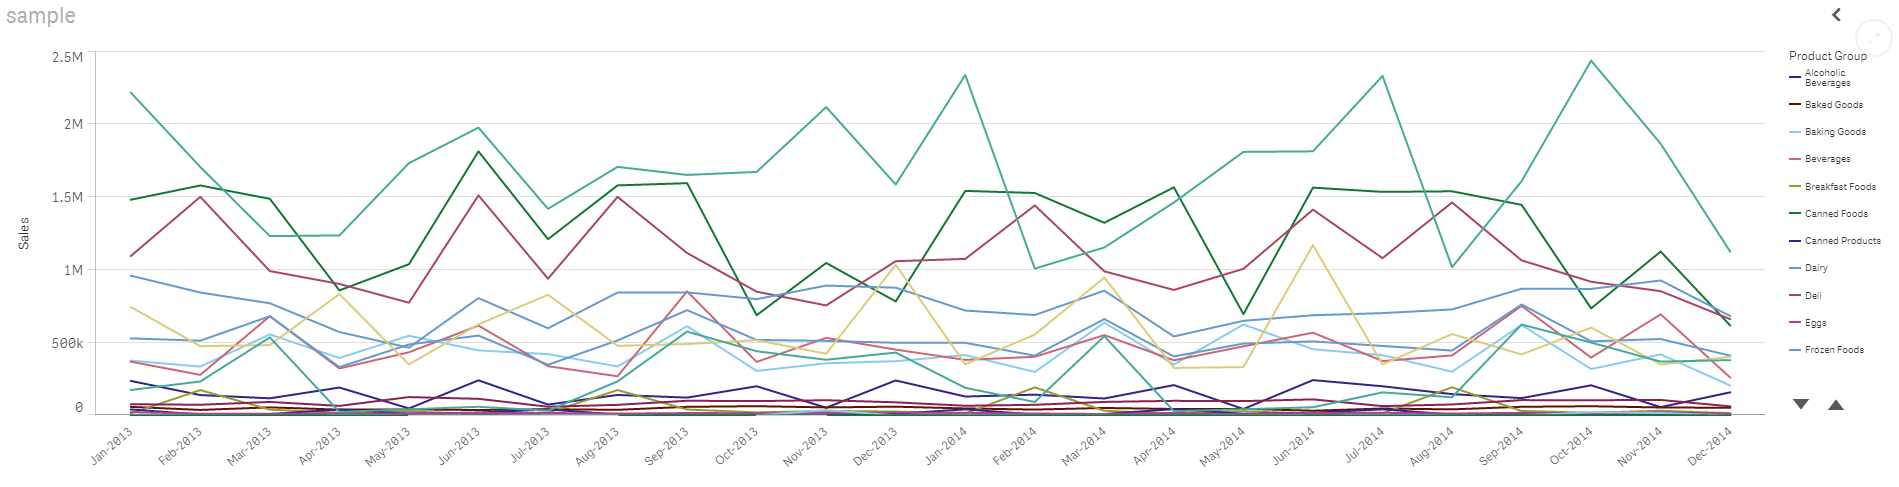
You probably don't want to create a separate dimension for each "Type" as it will make it very difficult to filter and aggregate data.
- Mark as New
- Bookmark
- Subscribe
- Mute
- Subscribe to RSS Feed
- Permalink
- Report Inappropriate Content
It sounds like you are looking for a line chart with two dimensions and one expression?
When setting up your line chart add your time dimension first, in your case this seems to be date, then add a second dimension of type and lastly add your expression as the count of calls.
You should end up with something like this
You probably don't want to create a separate dimension for each "Type" as it will make it very difficult to filter and aggregate data.