Unlock a world of possibilities! Login now and discover the exclusive benefits awaiting you.

- Qlik Community
- :
- Forums
- :
- Analytics & AI
- :
- Products & Topics
- :
- Visualization and Usability
- :
- Re: Cumulative current and previous year compariso...
- Subscribe to RSS Feed
- Mark Topic as New
- Mark Topic as Read
- Float this Topic for Current User
- Bookmark
- Subscribe
- Mute
- Printer Friendly Page

- Mark as New
- Bookmark
- Subscribe
- Mute
- Subscribe to RSS Feed
- Permalink
- Report Inappropriate Content
Cumulative current and previous year comparison
HI,
I have these data ant I need to compare current and previous year sales and cumulative current and previous year sales:
| Year | Month | current Sales | Previous sales | Sales evolution | current Cumulative Sales | Previous cumulative sales | previous Sales evolution |
| 2016 | jan. | $ 3.210.255,67 | $ 2.916.318,75 | $ 3.210.255,67 | $ 2.916.318,75 | ||
| 2016 | feb. | $ 2.416.694,16 | $ 2.619.870,73 | $ 5.626.949,83 | $ 5.536.189,48 | ||
| 2016 | mar. | $ 3.136.653,17 | $ 3.427.868,53 | $ 8.763.603,00 | $ 8.964.058,01 | ||
| 2016 | apr. | $ 3.014.915,70 | $ 2.970.871,88 | $ 11.778.518,70 | $ 11.934.929,89 | ||
| 2016 | may. | $ 3.224.530,82 | $ 2.936.163,16 | $ 15.003.049,52 | $ 14.871.093,05 | ||
| 2016 | jun. | $ 3.122.416,11 | $ 2.879.275,88 | $ 18.125.465,63 | $ 17.750.368,93 | ||
| 2016 | jul. | $ 3.820.239,27 | $ 3.237.616,84 | $ 21.945.704,90 | $ 20.987.985,77 | ||
| 2016 | aug. | $ 3.057.424,10 | $ 3.519.914,18 | $ 25.003.129,00 | $ 24.507.899,95 | ||
| 2016 | sept. | $ 3.191.870,08 | $ 3.790.792,88 | $ 28.194.999,08 | $ 28.298.692,83 | ||
| 2016 | oct. | $ 3.233.443,83 | $ 3.234.116,17 | $ 31.428.442,91 | $ 31.532.809,00 | ||
| 2016 | nov. | $ 2.600.200,37 | $ 2.815.782,99 | $ 34.028.643,28 | $ 34.348.591,99 | ||
| 2016 | dic. | $ 3.014.417,02 | $ 2.915.944,48 | $ 37.043.060,30 | $ 37.264.536,47 | ||
| 2017 | jan. | $ 2.655.247,31 | $ 3.210.255,67 | 17,29% | $ 2.655.247,31 | $ 3.210.255,67 | 17,29% |
| 2017 | feb. | $ 3.012.526,90 | $ 2.416.694,16 | -24,65% | $ 5.667.774,21 | $ 5.626.949,83 | -0,73% |
| 2017 | mar. | $ 3.291.494,73 | $ 3.136.653,17 | -4,94% | $ 8.959.268,94 | $ 8.763.603,00 | -2,23% |
| 2017 | apr. | $ 3.100.229,69 | $ 3.014.915,70 | -2,83% | $ 12.059.498,63 | $ 11.778.518,70 | -2,39% |
| 2017 | may. | $ 3.801.179,75 | $ 3.224.530,82 | -17,88% | $ 15.860.678,38 | $ 15.003.049,52 | -5,72% |
| 2017 | jun. | $ 3.302.255,26 | $ 3.122.416,11 | -5,76% | $ 19.162.933,64 | $ 18.125.465,63 | -5,72% |
| 2017 | jul. | $ 3.104.700,53 | $ 3.820.239,27 | 18,73% | $ 22.267.634,17 | $ 21.945.704,90 | -1,47% |
| 2017 | aug. | $ 3.977.982,00 | $ 3.057.424,10 | -30,11% | $ 26.245.616,17 | $ 25.003.129,00 | -4,97% |
| 2017 | sept. | $ 3.211.017,79 | $ 3.191.870,08 | -0,60% | $ 29.456.633,96 | $ 28.194.999,08 | -4,47% |
| 2017 | oct. | $ 3.705.129,89 | $ 3.233.443,83 | -14,59% | $ 33.161.763,85 | $ 31.428.442,91 | -5,52% |
| 2017 | nov. | $ 3.247.800,47 | $ 2.600.200,37 | -24,91% | $ 36.409.564,32 | $ 34.028.643,28 | -7,00% |
| 2017 | dic. | $ 3.351.796,31 | $ 3.014.417,02 | -11,19% | $ 39.761.360,63 | $ 37.043.060,30 | -7,34% |
I used this scrip:
vCurrentYear = Max(Year)
vPreviousYear = Max(Year-1)
vCurrentSales = sum({<Year={$(vCurrentYear)}>}Sales)
vPreviousSales = sum({<Year={$(vPreviousYear)}>}Sales)
vSalesEvolution = 1 - $(vCurrentSales)/$(vPreviousSales)
vCumSales = RangeSum(Above($(vCurrentSales), 0, RowNo()))
vCumPreviousSales = RangeSum(Above($(vPreviousSales), 0, RowNo()))
vCumSalesEvolution = 1 - $(vCurrentSales)/$(vPreviousSales)
I have these results for current sales:
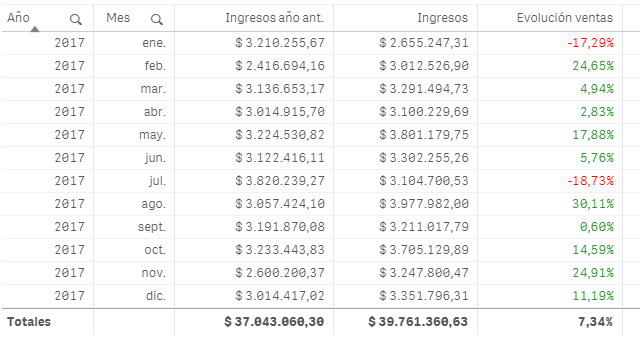
But I can have the results for cumulative sales:
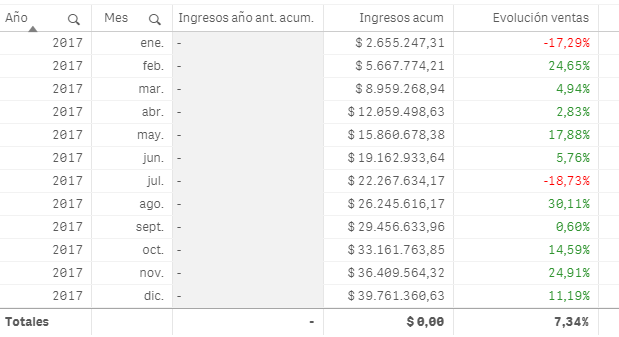
Could someone help me please?
- Mark as New
- Bookmark
- Subscribe
- Mute
- Subscribe to RSS Feed
- Permalink
- Report Inappropriate Content
Sunny, I don´t found the mistake.
Despite in the qvf file you send me is working, in the complete model is not.
The data in the complete model is confidential, so I can´t share it in the community...I´m stuck.
Do you know a way to solve this problem?
- Mark as New
- Bookmark
- Subscribe
- Mute
- Subscribe to RSS Feed
- Permalink
- Report Inappropriate Content
Thanks for your answer, but I need the sales be cumulative. I mean, not the previous year sales but the cumulative previous year sales

 NZFei
NZFei
- Mark as New
- Bookmark
- Subscribe
- Mute
- Subscribe to RSS Feed
- Permalink
- Report Inappropriate Content
Are you sure in the complete model, the two dimensions are year and month and they have been sorted?

 sunny_talwar
- Mark as New
- Bookmark
- Subscribe
- Mute
- Subscribe to RSS Feed
- Permalink
- Report Inappropriate Content
Two questions
1) Do you have date and time related fields where you might be making selection?
2) You did try to change your vPreviousYear variable, right? I just want to make sure that you didn't mind reading it.
- Mark as New
- Bookmark
- Subscribe
- Mute
- Subscribe to RSS Feed
- Permalink
- Report Inappropriate Content
Yes Fei, I´m pretty sure.
In fact, the qvf file I attached previously has a part of the original script and tha table and formulas were copied from it (I tested it with the whole script previously)
- Mark as New
- Bookmark
- Subscribe
- Mute
- Subscribe to RSS Feed
- Permalink
- Report Inappropriate Content
2 answers:
1) I have the, but not in the page where I have these variables
2) I replace my old variable by vAño=((Max(Año)-1))
(spanish model)

 adj29block
- Mark as New
- Bookmark
- Subscribe
- Mute
- Subscribe to RSS Feed
- Permalink
- Report Inappropriate Content
Hello,
I propose the following way using RangeSum and Above in a crosstab, with a visualization in a bar chart.
Dimension: Year and Month
Measure: RangeSum (Above (Sum (Sales), 0, rowno ()))
Important:
I recovered your data and modified some of them.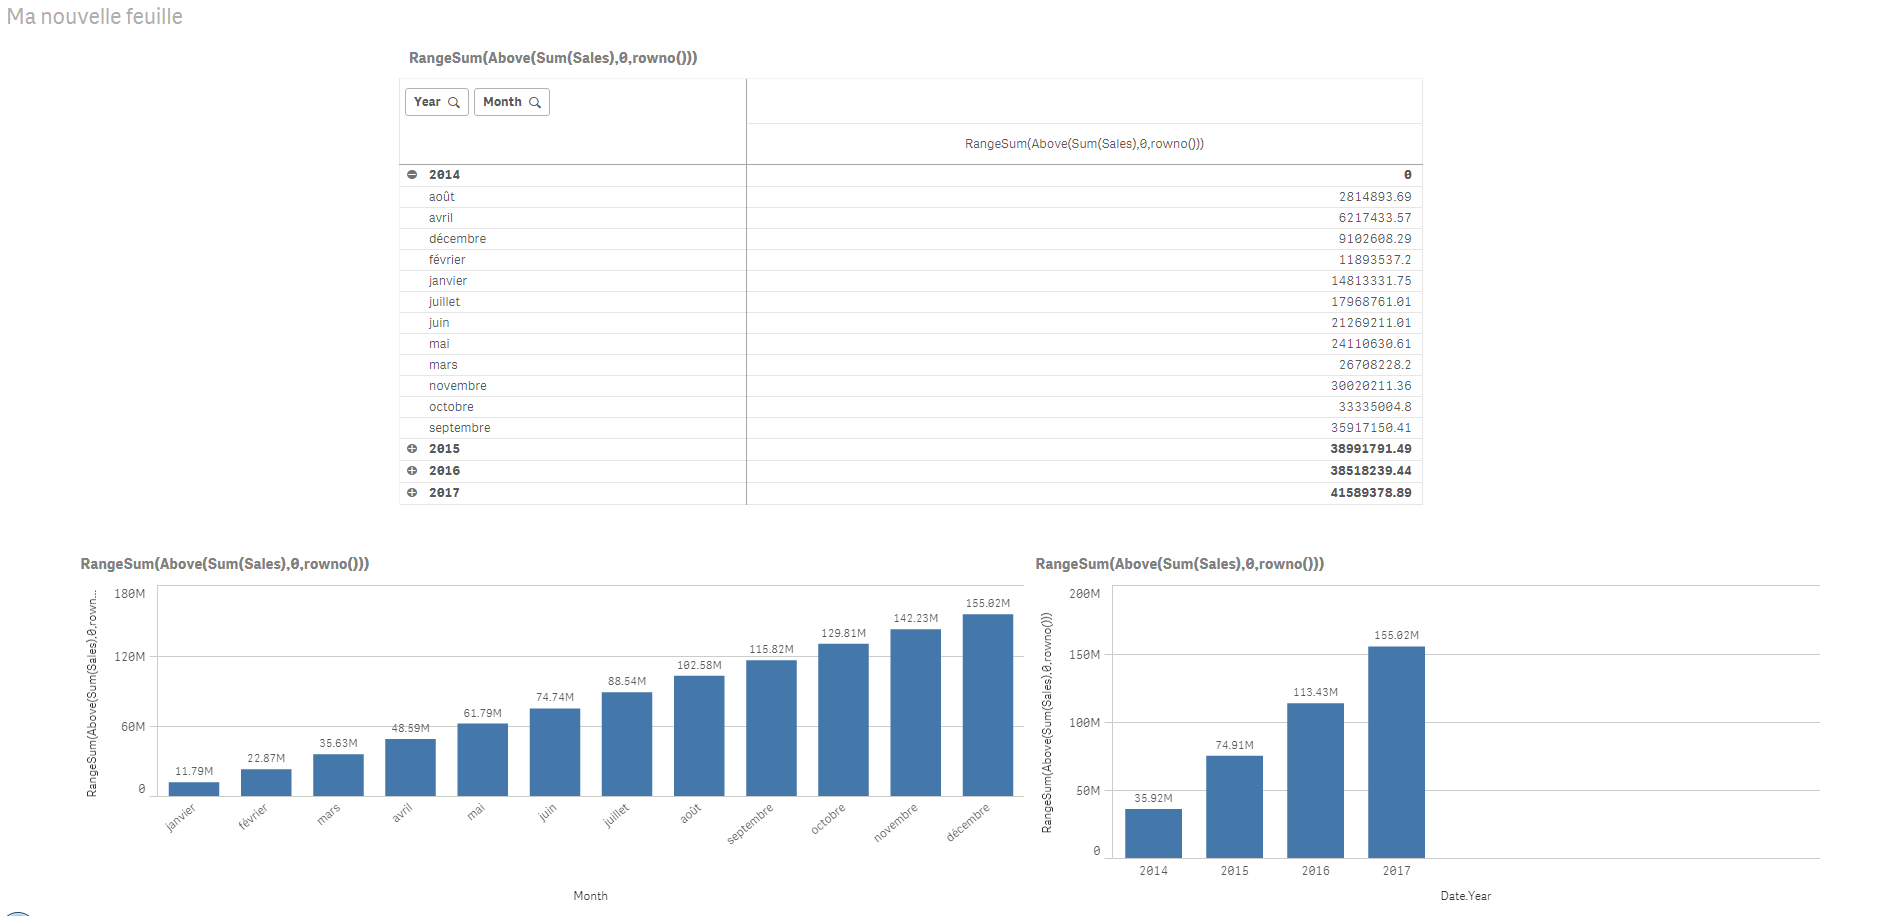
I hope this will help you.
J-B C
adj29block
- Mark as New
- Bookmark
- Subscribe
- Mute
- Subscribe to RSS Feed
- Permalink
- Report Inappropriate Content
You can have an explanation on the site Accumulation in Qlik Sense | Qlik Community
Have a good day
J-B C
sunny_talwar
- Mark as New
- Bookmark
- Subscribe
- Mute
- Subscribe to RSS Feed
- Permalink
- Report Inappropriate Content
For one, are you making selections in any of those fields while trying to viewing this chart?
- Mark as New
- Bookmark
- Subscribe
- Mute
- Subscribe to RSS Feed
- Permalink
- Report Inappropriate Content
No I´m not making any selection in filter fields
It´s not a chart but a table