Unlock a world of possibilities! Login now and discover the exclusive benefits awaiting you.

- Qlik Community
- :
- Forums
- :
- Analytics & AI
- :
- Products & Topics
- :
- Visualization and Usability
- :
- Re: Current vs Previous month Stock
- Subscribe to RSS Feed
- Mark Topic as New
- Mark Topic as Read
- Float this Topic for Current User
- Bookmark
- Subscribe
- Mute
- Printer Friendly Page

 agnie_john
- Mark as New
- Bookmark
- Subscribe
- Mute
- Subscribe to RSS Feed
- Permalink
- Report Inappropriate Content
Current vs Previous month Stock
Hi,
I have a Fact table which contains Year Month Wise Stock(Inventory) and Shipped Quantity details.
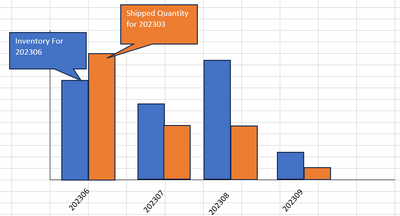
I would like to show a bar chart having Year Month as Dimension with two measures
1. Inventory Quantity
2. Shipped Quantity (3 months Before)
For example
Inventory of each month as bar chart. I need to show one more bar with shipped quantity of YearMonth-3
Thanks,
John

 G3S
G3S
- Mark as New
- Bookmark
- Subscribe
- Mute
- Subscribe to RSS Feed
- Permalink
- Report Inappropriate Content
try using addmonths function to calculate the value for 3months prior

 Aditya_Chitale
- Mark as New
- Bookmark
- Subscribe
- Mute
- Subscribe to RSS Feed
- Permalink
- Report Inappropriate Content
you cannot use set analysis here, as set analysis calculates value only for 1 row and not all rows.
Try using above() function but keep in mind that your chart should have only 1 dimension (in your case Year Month) and arrange the Year Month dimension in ascending order in chart.
Expression:
=Above(Sum(ShippedQty),3)
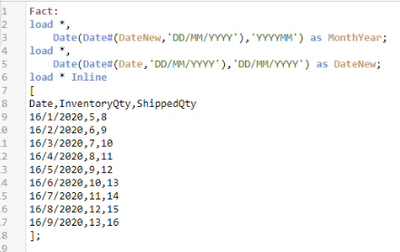
Sample Data Used:
Output:
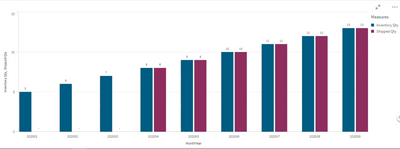
Regards,
Aditya
 John_Peter
- Mark as New
- Bookmark
- Subscribe
- Mute
- Subscribe to RSS Feed
- Permalink
- Report Inappropriate Content
Thanks for your reply.
understand that i can use above function,my problem is instead of three i want to display shipping qty of 11 months before.even though the chart show 12 months data i would like to show 11 month old data for each row.
I think it is not possible i will go with load script.
Please let me know if any other method to achieve this.
Regards,
John.
Aditya_Chitale
- Mark as New
- Bookmark
- Subscribe
- Mute
- Subscribe to RSS Feed
- Permalink
- Report Inappropriate Content
Hi @John_Peter ,
Sorry for the late reply. Hope you have solved the problem by now. If not, please try below solution achieved using script load editor.
I have calculated previous 3 month Shipped Qty values for each Date in the script itself. You can replace the digit '3' with any number for showing previous N month values according to your need. The months which don't have adequate previous months for calculating previous N month values will show the current month values against them.

Regards,
Aditya
