Unlock a world of possibilities! Login now and discover the exclusive benefits awaiting you.
- Qlik Community
- :
- Forums
- :
- Analytics & AI
- :
- Products & Topics
- :
- Visualization and Usability
- :
- Re: Custom colours in stacked bar chart in Qliksen...
- Subscribe to RSS Feed
- Mark Topic as New
- Mark Topic as Read
- Float this Topic for Current User
- Bookmark
- Subscribe
- Mute
- Printer Friendly Page
- Mark as New
- Bookmark
- Subscribe
- Mute
- Subscribe to RSS Feed
- Permalink
- Report Inappropriate Content
Custom colours in stacked bar chart in Qliksense
Hi All,
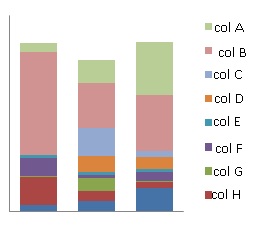
I have strange a requirement to colour stacked bar chart. I have to colour dimension values (col A in red, col B in blue and col C in Green) and rest of the dimension values (col D to H ) should be coloured with default colours. Is this possible?
- Mark as New
- Bookmark
- Subscribe
- Mute
- Subscribe to RSS Feed
- Permalink
- Report Inappropriate Content
I think not possible
- Mark as New
- Bookmark
- Subscribe
- Mute
- Subscribe to RSS Feed
- Permalink
- Report Inappropriate Content
Hi Manoj,
I am afraid that's not possible.
- Mark as New
- Bookmark
- Subscribe
- Mute
- Subscribe to RSS Feed
- Permalink
- Report Inappropriate Content
Hi,
what you want to do is possible. It is just a little bit complicated. You wil have to set colors for all columns (it is not possible to set only three and let the rest "default")
Do you use only one measure (like sum(sales)) and it is split by dimension (col A)?
If so, than go to Apperance->colors and Legend, set colors to custom and select by expression.
Than set it like this
If(<your dimension>='col A',RGB(170,255,106),
If(<your dimension>='col B',RGB(85,232,216),
If(<your dimension>='col C',RGB(232,192,85),
If(<your dimension>='col D',RGB(124,116,255),
If(<your dimension>='col E',RGB(255,123,99),
If(<your dimension>='col F',RGB(153,129,96),
If(<your dimension>='col G',RGB(204,127,27),
If(<your dimension>='col H',RGB(27,204,72)))))))))
Of course use your own RGB value (or if you like it you can use this  ) You should get something like this
You can refer https://help.qlik.com/en-US/sense/June2018/Subsystems/Hub/Content/Colors/color-by-expression.htm
- Mark as New
- Bookmark
- Subscribe
- Mute
- Subscribe to RSS Feed
- Permalink
- Report Inappropriate Content
In Stacked Bar chart - Add Dimensions, measures.
Appearance - Colors & Legend - By dimension.
For Expression wise color apply:
Use below expression, tweak your main expression.
pick(match(Dimension,'K1','E1','B1','B2','B3','Bx'),lightred(),lightblue(),LightGreen(),LightGray(),LightMagenta(),yellow())
- Mark as New
- Bookmark
- Subscribe
- Mute
- Subscribe to RSS Feed
- Permalink
- Report Inappropriate Content
Check this too:
- Mark as New
- Bookmark
- Subscribe
- Mute
- Subscribe to RSS Feed
- Permalink
- Report Inappropriate Content
Thanks guys for your suggestions. I got to know this is not possible.
- Mark as New
- Bookmark
- Subscribe
- Mute
- Subscribe to RSS Feed
- Permalink
- Report Inappropriate Content
I think it's a new feature, but I am using the feb 19' version and now we have a solution for that.
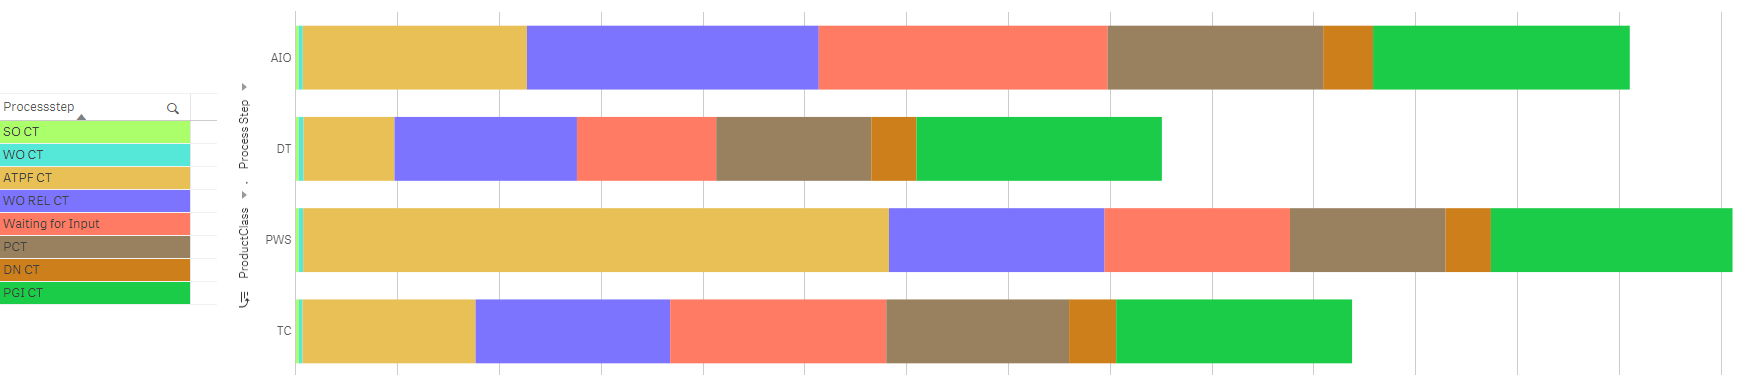
1-) Create a master dimension with the exact field name you want to select the color, put a name on it, clik "Add dimension" and "Done".

2-) Right click in the dimesion created, and then go to Value color and select a color for each factor on the list.

3-) Now when you create a stacked bar chart, the colors will follow your instructions for this field.
Hope it helps.
- Mark as New
- Bookmark
- Subscribe
- Mute
- Subscribe to RSS Feed
- Permalink
- Report Inappropriate Content
this is really helpful.
After adding custom colors by expression, graph lost its Index. anyway to show it as per newly applied colors.