Unlock a world of possibilities! Login now and discover the exclusive benefits awaiting you.

- Qlik Community
- :
- Forums
- :
- Analytics & AI
- :
- Products & Topics
- :
- Visualization and Usability
- :
- Difference between dimensions and time series
- Subscribe to RSS Feed
- Mark Topic as New
- Mark Topic as Read
- Float this Topic for Current User
- Bookmark
- Subscribe
- Mute
- Printer Friendly Page

 alexandernatale
- Mark as New
- Bookmark
- Subscribe
- Mute
- Subscribe to RSS Feed
- Permalink
- Report Inappropriate Content
Difference between dimensions and time series
Hello,
I have a problem that I can't solve. I have a table made up of:
| date | Country | ValueDimension 1 | ValueDimension 2 |
I want to represent on a graph, for each country, the daily difference of the sum of ValueDimension1 and ValueDimension2
(ValueDimension1 [Day 2] + ValueDimension2 [Day 2] - {ValueDimension1 [Day1] + ValueDimension2 [Day1]}
I have tried with:
sum (ValueDimension1) + sum (ValueDimension2) - (Above (sum (ValueDimension1) + sum (ValueDimension2)), 1)
but what it creates is an "unordered" difference. How can I solve it?
Thank you all
Accepted Solutions
alexandernatale
- Mark as New
- Bookmark
- Subscribe
- Mute
- Subscribe to RSS Feed
- Permalink
- Report Inappropriate Content
I'm sorry for that but I tried the solution.
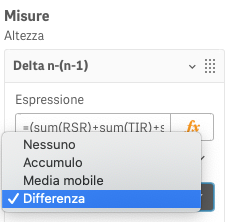
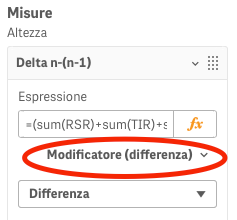
In the "Measures", there is an option to calculate the expression: the modificator. In the option there is "difference".
alexandernatale
- Mark as New
- Bookmark
- Subscribe
- Mute
- Subscribe to RSS Feed
- Permalink
- Report Inappropriate Content
I'm sorry for that but I tried the solution.
In the "Measures", there is an option to calculate the expression: the modificator. In the option there is "difference".
