Unlock a world of possibilities! Login now and discover the exclusive benefits awaiting you.

- Qlik Community
- :
- Forums
- :
- Analytics & AI
- :
- Products & Topics
- :
- Visualization and Usability
- :
- Dimension sum to 100% within another dimension
- Subscribe to RSS Feed
- Mark Topic as New
- Mark Topic as Read
- Float this Topic for Current User
- Bookmark
- Subscribe
- Mute
- Printer Friendly Page

 kennethand
- Mark as New
- Bookmark
- Subscribe
- Mute
- Subscribe to RSS Feed
- Permalink
- Report Inappropriate Content
Dimension sum to 100% within another dimension
Using this expression:
Sum( {< Periode={"2018K2"}> }weight) / Sum(TOTAL{<Periode={"2018K2"}> } weight)
I can create this bar chart (sum to 100%):
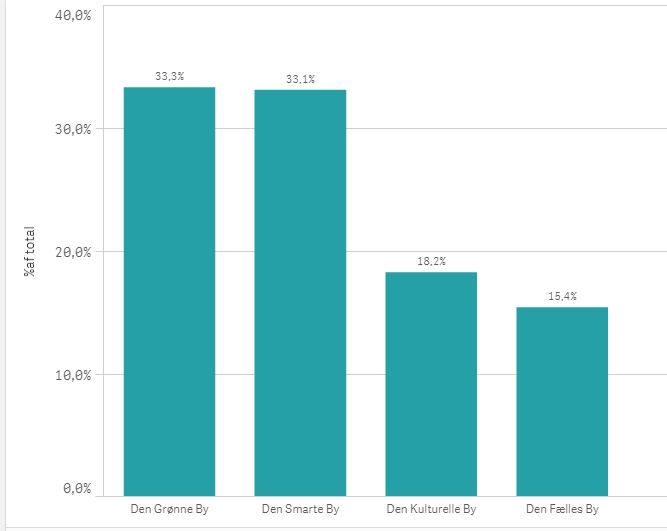
But how do show the this within another dimension? I like to show this in one graph per age-group.
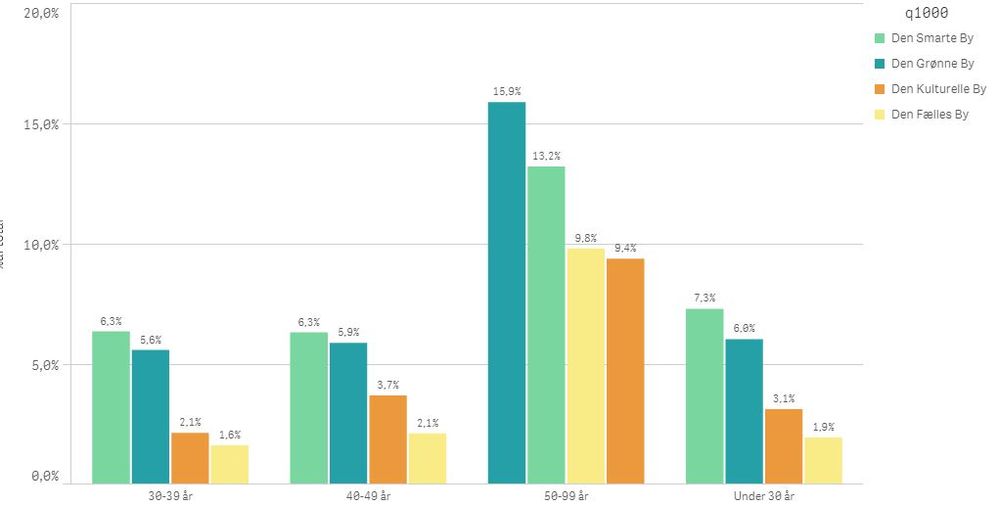
But as you can see the graph shows me the 100% distributed 'over all'. I like to see the 100% distribution within every age-group. Ex. for 30-39 years I like to see the distribution of 100%. For 40-49 yrs. I also like to see the distribution of 100% and so on.
How do I need change my expression?
Accepted Solutions

 pradosh_thakur
- Mark as New
- Bookmark
- Subscribe
- Mute
- Subscribe to RSS Feed
- Permalink
- Report Inappropriate Content
Hi
try the below
Let's name your dimension 1 and dimension 2
Sum( weight) / Sum(TOTAL <dimension1> weight)

 OmarBenSalem
- Mark as New
- Bookmark
- Subscribe
- Mute
- Subscribe to RSS Feed
- Permalink
- Report Inappropriate Content
and u can always keep ur condition:
Sum( {< Periode={"2018K2"}> }weight) / Sum(TOTAL <dimension1> {<Periode={"2018K2"}> } weight)
pradosh_thakur
- Mark as New
- Bookmark
- Subscribe
- Mute
- Subscribe to RSS Feed
- Permalink
- Report Inappropriate Content
Hi
try the below
Let's name your dimension 1 and dimension 2
Sum( weight) / Sum(TOTAL <dimension1> weight)
OmarBenSalem
- Mark as New
- Bookmark
- Subscribe
- Mute
- Subscribe to RSS Feed
- Permalink
- Report Inappropriate Content
and u can always keep ur condition:
Sum( {< Periode={"2018K2"}> }weight) / Sum(TOTAL <dimension1> {<Periode={"2018K2"}> } weight)
