Unlock a world of possibilities! Login now and discover the exclusive benefits awaiting you.

- Qlik Community
- :
- Forums
- :
- Analytics & AI
- :
- Products & Topics
- :
- Visualization and Usability
- :
- Re: Distinct Total different in text box and chart
- Subscribe to RSS Feed
- Mark Topic as New
- Mark Topic as Read
- Float this Topic for Current User
- Bookmark
- Subscribe
- Mute
- Printer Friendly Page

 inescastelhano
- Mark as New
- Bookmark
- Subscribe
- Mute
- Subscribe to RSS Feed
- Permalink
- Report Inappropriate Content
Distinct Total different in text box and chart
Dear all,
I am facing the following problem:
I have several representatives, each of them can work in more than one region.
However, in order to know how many representatives I have in each region, I am using the following expression (column "Value", where the total is configured to be the sum of values):
Count( {(<Regions -={' '}, Filter_field ={'Something'}>}distinct REP_CODE) -> 963
To count the total, I am using the following expression:
Count( {(<Regions -={' '}, Filter_field ={'Something'}>}total distinct REP_CODE) -> 955
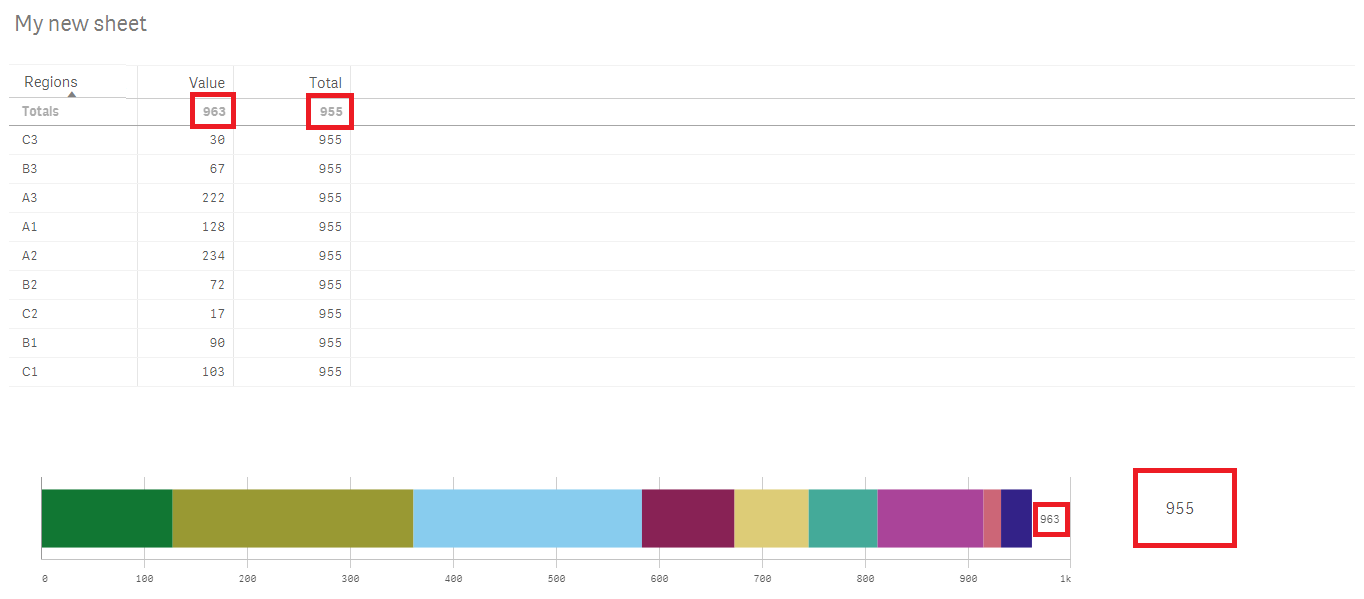
Then, when summing inside a specific region, that representative may be unique (distinct) but in the whole set it isn't. Thus, the sum of the distincts is different the total sum. Finally, when I use the expression to get the distribution (percentage), I get a total of 100.8% (963 instead of 955).
Do you have any ideas on how to overcome this?
Thanks in advance!
Ines
- Tags:
- total function
Accepted Solutions

 sunny_talwar
- Mark as New
- Bookmark
- Subscribe
- Mute
- Subscribe to RSS Feed
- Permalink
- Report Inappropriate Content
Try this for total
Sum(TOTAL Aggr(Count( {(<Regions -={' '}, Filter_field ={'Something'}>}distinct REP_CODE), Regions))
This should give you 963 for denominator.
sunny_talwar
- Mark as New
- Bookmark
- Subscribe
- Mute
- Subscribe to RSS Feed
- Permalink
- Report Inappropriate Content
Try this for total
Sum(TOTAL Aggr(Count( {(<Regions -={' '}, Filter_field ={'Something'}>}distinct REP_CODE), Regions))
This should give you 963 for denominator.
sunny_talwar
- Mark as New
- Bookmark
- Subscribe
- Mute
- Subscribe to RSS Feed
- Permalink
- Report Inappropriate Content
In KPI Object, you might be able to just try this
Sum(Aggr(Count( {(<Regions -={' '}, Filter_field ={'Something'}>}distinct REP_CODE), Regions))
inescastelhano
- Mark as New
- Bookmark
- Subscribe
- Mute
- Subscribe to RSS Feed
- Permalink
- Report Inappropriate Content
Thank you so much!
