Unlock a world of possibilities! Login now and discover the exclusive benefits awaiting you.

- Qlik Community
- :
- Forums
- :
- Analytics & AI
- :
- Products & Topics
- :
- Visualization and Usability
- :
- Drill Down Dimension
- Subscribe to RSS Feed
- Mark Topic as New
- Mark Topic as Read
- Float this Topic for Current User
- Bookmark
- Subscribe
- Mute
- Printer Friendly Page

 QlikBeginner1
- Mark as New
- Bookmark
- Subscribe
- Mute
- Subscribe to RSS Feed
- Permalink
- Report Inappropriate Content
Drill Down Dimension
Hi,
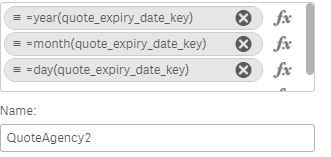
I have created a bar chart, and wanted to create a drill down dimension, which I can create and is working OK.
The first level is the year, the second level is the month and the third level will be the day.
When I have tried to use the month function, this is fine, however I wanted the graph to show the month and year instead of just the month itself.
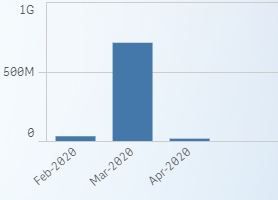
For example, I want the image to show Feb 2020.
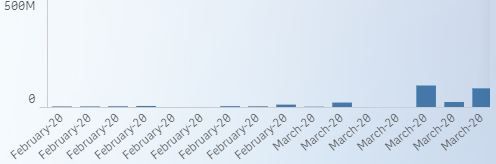
I have tried to use the expression date(quote_expiry_date_key, 'mmm-yyyy'), this kind of works, however it creates multiple Feb 2020 instead of grouping into one bar?
Thanks all ! 🙂
Accepted Solutions

 martinpohl
- Mark as New
- Bookmark
- Subscribe
- Mute
- Subscribe to RSS Feed
- Permalink
- Report Inappropriate Content
insight the data a date
02/25/2020
and
02/05/2020
are limited to visualize only month and year, but they know the individual date
so use
month(monthstart(quote_expire-Date_key))
instead
Regards
martinpohl
- Mark as New
- Bookmark
- Subscribe
- Mute
- Subscribe to RSS Feed
- Permalink
- Report Inappropriate Content
insight the data a date
02/25/2020
and
02/05/2020
are limited to visualize only month and year, but they know the individual date
so use
month(monthstart(quote_expire-Date_key))
instead
Regards
QlikBeginner1
- Mark as New
- Bookmark
- Subscribe
- Mute
- Subscribe to RSS Feed
- Permalink
- Report Inappropriate Content
Thank you sir!
=date(monthstart(quote_expiry_date_key),'MMM-YYYY')
This was the expression I used which is giving me what I wanted. Thank you for the guidence!
QlikBeginner1
- Mark as New
- Bookmark
- Subscribe
- Mute
- Subscribe to RSS Feed
- Permalink
- Report Inappropriate Content
To finish off this question,
I used this expression then to populate the day/month/year.
=date(daystart(quote_expiry_date_key),'DD-MMM-YYYY')
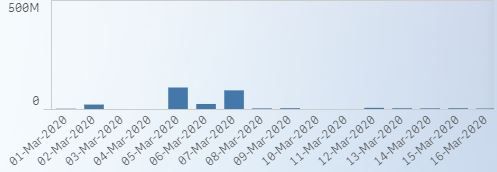
This is the output.