Unlock a world of possibilities! Login now and discover the exclusive benefits awaiting you.

Announcements
Talend Cloud AWS EU Scheduled Outage: Starting Tues 26 May 21:00 CEST with expected completion Wed 27 May 01:00 CEST
- Qlik Community
- :
- Forums
- :
- Analytics & AI
- :
- Products & Topics
- :
- Visualization and Usability
- :
- Dynamic changing x axis
Options
- Subscribe to RSS Feed
- Mark Topic as New
- Mark Topic as Read
- Float this Topic for Current User
- Bookmark
- Subscribe
- Mute
- Printer Friendly Page
Turn on suggestions
Auto-suggest helps you quickly narrow down your search results by suggesting possible matches as you type.
Showing results for

Not applicable
2016-05-23
07:18 PM
- Mark as New
- Bookmark
- Subscribe
- Mute
- Subscribe to RSS Feed
- Permalink
- Report Inappropriate Content
Dynamic changing x axis
Hi
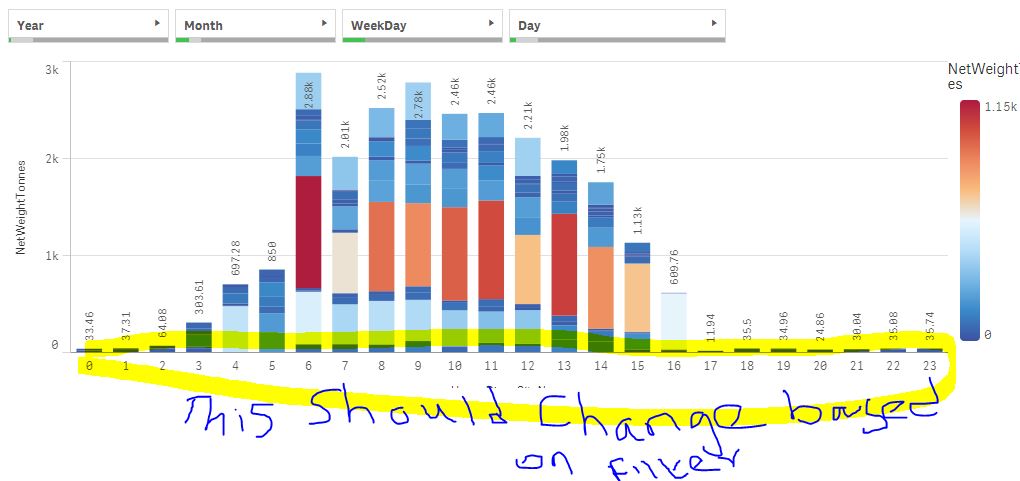
I got 5 list box filter Dimension as shown in figure (Year, Month, week, Day, Hour)
One for Year
One for Month
One for Week
One for Day
One for Hours
Graph to show
X axis – should change based on the list I choose
Measure Netweight
For eg if i choose year
X - axis should show year from jan - Dec (2016)
If i choose Month It should that month
If i choose week it should that week
1,309 Views
1 Reply

 Gysbert_Wassena
Partner - Champion III
2016-05-25
05:16 AM
- Mark as New
- Bookmark
- Subscribe
- Mute
- Subscribe to RSS Feed
- Permalink
- Report Inappropriate Content
Try using a drill down group dimension: Qlik Sense - Drill-down Group Dimension (video)
talk is cheap, supply exceeds demand
1,086 Views