Unlock a world of possibilities! Login now and discover the exclusive benefits awaiting you.
Announcements
Talend Cloud AWS EU Scheduled Outage: Starting Tues 26 May 21:00 CEST with expected completion Wed 27 May 01:00 CEST
- Qlik Community
- :
- Forums
- :
- Analytics & AI
- :
- Products & Topics
- :
- Visualization and Usability
- :
- Re: Expanding x axis dimension (by date)
Options
- Subscribe to RSS Feed
- Mark Topic as New
- Mark Topic as Read
- Float this Topic for Current User
- Bookmark
- Subscribe
- Mute
- Printer Friendly Page
Turn on suggestions
Auto-suggest helps you quickly narrow down your search results by suggesting possible matches as you type.
Showing results for
Not applicable
2015-01-27
03:39 AM
- Mark as New
- Bookmark
- Subscribe
- Mute
- Subscribe to RSS Feed
- Permalink
- Report Inappropriate Content
Expanding x axis dimension (by date)
Hi everyone.
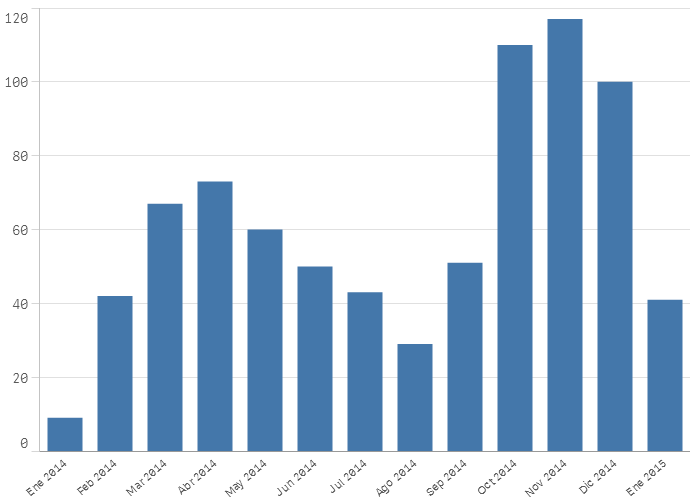
Is there a way to expand the time scale in a graph? I.e. I'd like to go from Grahp 1 (which shows values per month) to Graph 2 (which shows values for June 2014 -previously selected-) by clicking somewhere.
Graph 1
Graph 2

Thanks in advance.
1,049 Views
1 Solution
Accepted Solutions
MVP
2015-01-27
03:49 AM
- Mark as New
- Bookmark
- Subscribe
- Mute
- Subscribe to RSS Feed
- Permalink
- Report Inappropriate Content
You can Create Drill Down Group
Setting - >Document Properties ->Groups --> New -- > Select the DrillDown option and
First add your Month Dimension and then your Date dimension
2 Replies
MVP
2015-01-27
03:49 AM
- Mark as New
- Bookmark
- Subscribe
- Mute
- Subscribe to RSS Feed
- Permalink
- Report Inappropriate Content
You can Create Drill Down Group
Setting - >Document Properties ->Groups --> New -- > Select the DrillDown option and
First add your Month Dimension and then your Date dimension
Not applicable
2015-01-27
06:10 AM
Author
- Mark as New
- Bookmark
- Subscribe
- Mute
- Subscribe to RSS Feed
- Permalink
- Report Inappropriate Content
Great.
Thank you for such a quick response.
M.
888 Views