Unlock a world of possibilities! Login now and discover the exclusive benefits awaiting you.
- Qlik Community
- :
- Forums
- :
- Analytics & AI
- :
- Products & Topics
- :
- Visualization and Usability
- :
- Re: Get Alternative Field Value
- Subscribe to RSS Feed
- Mark Topic as New
- Mark Topic as Read
- Float this Topic for Current User
- Bookmark
- Subscribe
- Mute
- Printer Friendly Page
- Mark as New
- Bookmark
- Subscribe
- Mute
- Subscribe to RSS Feed
- Permalink
- Report Inappropriate Content
Get Alternative Field Value
Hello to all,
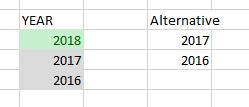
I need to show in a table (or otherwise store on one side).
That is, selecting one or values in a Filter pane, I would like to have a column with alternative values (in light gray).
For example:
Thanks,
Livio
- Mark as New
- Bookmark
- Subscribe
- Mute
- Subscribe to RSS Feed
- Permalink
- Report Inappropriate Content
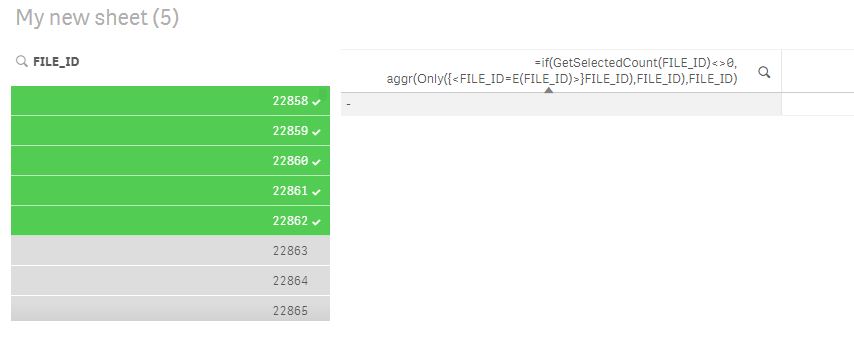
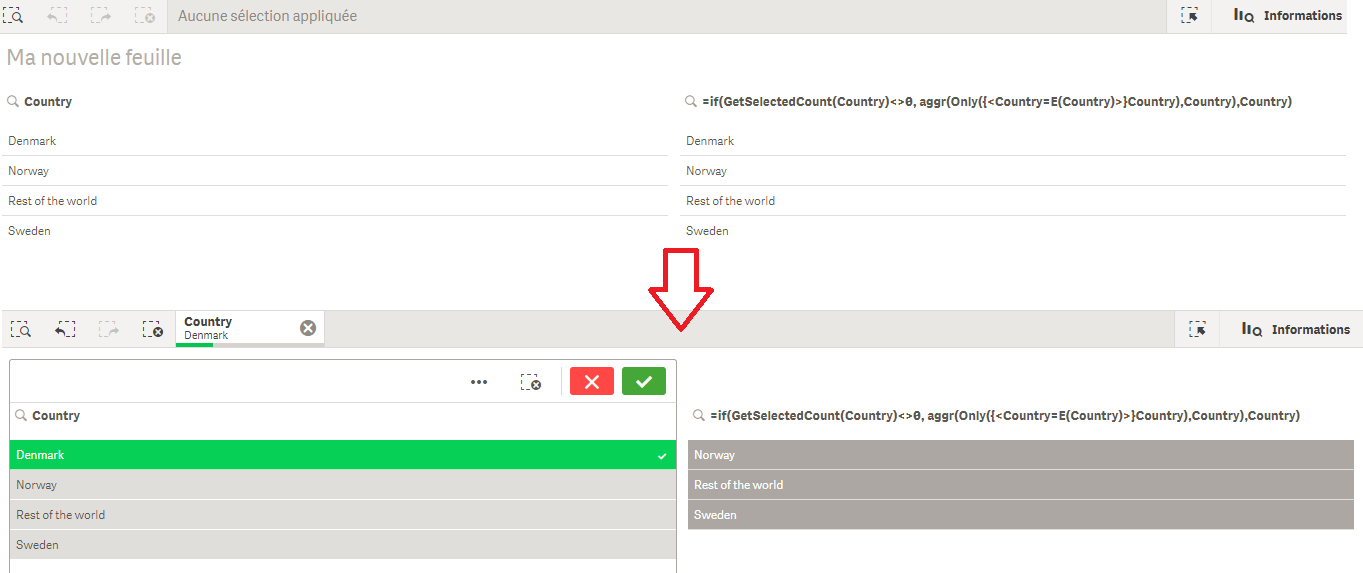
try this please and let me know (make sure that field name is correctly written and make sure to use a filterbox as object, textbox will require another expression):
=if(GetSelectedCount(Region)<>0, aggr(Only({<Region=E(Region)>}Region),Region),Region)
- Mark as New
- Bookmark
- Subscribe
- Mute
- Subscribe to RSS Feed
- Permalink
- Report Inappropriate Content
i don't know.
I use this expression to create a dimension on a table
- Mark as New
- Bookmark
- Subscribe
- Mute
- Subscribe to RSS Feed
- Permalink
- Report Inappropriate Content
I try but not woking.
- Mark as New
- Bookmark
- Subscribe
- Mute
- Subscribe to RSS Feed
- Permalink
- Report Inappropriate Content
take a look:
- Mark as New
- Bookmark
- Subscribe
- Mute
- Subscribe to RSS Feed
- Permalink
- Report Inappropriate Content
Sorry but I'm not understanding  Once you select a prompt value, I would like to have the same dimension values in a table, so you can add more information.
- Mark as New
- Bookmark
- Subscribe
- Mute
- Subscribe to RSS Feed
- Permalink
- Report Inappropriate Content
Ok I got it, I thought you were using a second listbox to list the excluded values, the expression I gave works only on a listbox
I think this will work perfectly on a table:
=Only( {$<Region= E({1<Region={"$(=getfieldselections(Region))"}>})>} Region)
- Mark as New
- Bookmark
- Subscribe
- Mute
- Subscribe to RSS Feed
- Permalink
- Report Inappropriate Content
Sorry, but not work again
- Mark as New
- Bookmark
- Subscribe
- Mute
- Subscribe to RSS Feed
- Permalink
- Report Inappropriate Content
create sample app with the same issue and share it with us
- Mark as New
- Bookmark
- Subscribe
- Mute
- Subscribe to RSS Feed
- Permalink
- Report Inappropriate Content
How I can add the file qvf here?
- Mark as New
- Bookmark
- Subscribe
- Mute
- Subscribe to RSS Feed
- Permalink
- Report Inappropriate Content
you should use the "advanced editor" like described in this topic