Unlock a world of possibilities! Login now and discover the exclusive benefits awaiting you.

Announcements
Share your agentic AI experience, learn from others, and earn a new badge: Put Agentic AI to Work
- Qlik Community
- :
- Forums
- :
- Analytics & AI
- :
- Products & Topics
- :
- Visualization and Usability
- :
- Gradient color in pivot table
Options
- Subscribe to RSS Feed
- Mark Topic as New
- Mark Topic as Read
- Float this Topic for Current User
- Bookmark
- Subscribe
- Mute
- Printer Friendly Page
Turn on suggestions
Auto-suggest helps you quickly narrow down your search results by suggesting possible matches as you type.
Showing results for

 ks20
ks20
Contributor III
2023-08-13
10:03 PM
- Mark as New
- Bookmark
- Subscribe
- Mute
- Subscribe to RSS Feed
- Permalink
- Report Inappropriate Content
Gradient color in pivot table
Hi Community,
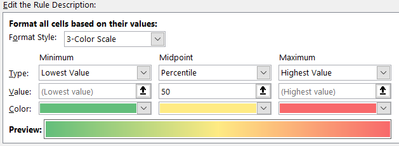
I need to have background color expression for my pivot table, where the minimum is the lowest value, midpoint is 50% and maximum is the highest value.
Dimension: week,date
Measure: sum(A)/sum(B)
Any guidance would be appreciated. Thank you!
Labels (7)
Labels
- Subscribe by Topic:
-
Chart
-
dimension
-
expression
-
filter
-
Set Analysis
-
Variables
-
Visualization
3 Replies

 MatheusC
Specialist III
2023-08-14
10:51 AM
- Mark as New
- Bookmark
- Subscribe
- Mute
- Subscribe to RSS Feed
- Permalink
- Report Inappropriate Content
Olá, @ks20
Essa expressão pode te atender, altere conforme sua necessidade,
vídeo explicativo. Espero que ajude!
https://youtu.be/DWoootVjdxs
ColorMix2(
(
avg([Total-Venda])
-
min(total
Agr(
avg([Total-Venda])
,Filial))
-
(
Max(total
Agr(
avg([Total-Venda])
,Filial))
-
min(total
Agr(
avg([Total-Venda])
,Filial))
)
/
2
)
/
(
(
Max(total
Agr(
avg([Total-Venda])
,Filial))
-
min(total
Agr(
avg([Total-Venda])
,Filial))
)
/
2
)
,
Vermelho(),
Verde(),
Amarelo()
)
Did you find a solution to your question? Mark the solution as accepted ✅ and if you found it useful, press the like button!
1,264 Views
MatheusC
Specialist III
2023-08-18
08:52 AM
- Mark as New
- Bookmark
- Subscribe
- Mute
- Subscribe to RSS Feed
- Permalink
- Report Inappropriate Content
@ks20
If you have solved your question, close the topic with the solution to help the qlik community.
Thanks
Did you find a solution to your question? Mark the solution as accepted ✅ and if you found it useful, press the like button!
1,233 Views
ks20
Contributor III
2023-08-20
08:23 PM
Author
- Mark as New
- Bookmark
- Subscribe
- Mute
- Subscribe to RSS Feed
- Permalink
- Report Inappropriate Content
Thanks for you response, but the solution din't work in my case.
