Unlock a world of possibilities! Login now and discover the exclusive benefits awaiting you.

- Qlik Community
- :
- Forums
- :
- Analytics & AI
- :
- Products & Topics
- :
- Visualization and Usability
- :
- Re: Group Bar Chart Month-wise
- Subscribe to RSS Feed
- Mark Topic as New
- Mark Topic as Read
- Float this Topic for Current User
- Bookmark
- Subscribe
- Mute
- Printer Friendly Page

 FlAsh92
- Mark as New
- Bookmark
- Subscribe
- Mute
- Subscribe to RSS Feed
- Permalink
- Report Inappropriate Content
Group Bar Chart Month-wise
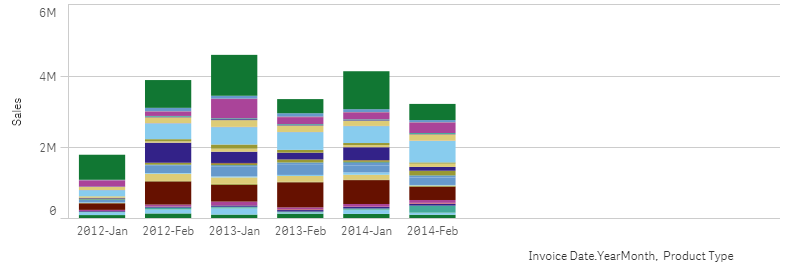
This my sales chart. I would like to be able to compare my monthly sales over year. For this, I need to group the bars month wise.
For eg: for the above chart i want the bars to be displayed in the following order: 2012 Jan, 2013 Jan, 2014 Jan, 2012 Feb, 2013 Feb, 2014 Feb.
Kindly suggest the changes that need to be made in the presentation of the chart
- Tags:
- bar chart
Accepted Solutions

 lironbaram
- Mark as New
- Bookmark
- Subscribe
- Mute
- Subscribe to RSS Feed
- Permalink
- Report Inappropriate Content
hi
why did you change the dimension
you just need to use this expression under the sort option of the dimension
so go back to your basic dimension , and under the sort settings select the option to sort by expression
lironbaram
- Mark as New
- Bookmark
- Subscribe
- Mute
- Subscribe to RSS Feed
- Permalink
- Report Inappropriate Content
hi
you can sort the month dimension with expression like this
num(month(DIMENSION FIELD)) + year(DIMENSION FIELD)/100000
FlAsh92
- Mark as New
- Bookmark
- Subscribe
- Mute
- Subscribe to RSS Feed
- Permalink
- Report Inappropriate Content
hello @lironbaram , thanks for the reply!!
The expression that you shared works perfectly!!
But the only issue is the labels at the bottom of each bars, they do not display the Year-Month anymore. Attaching the screenshot below.
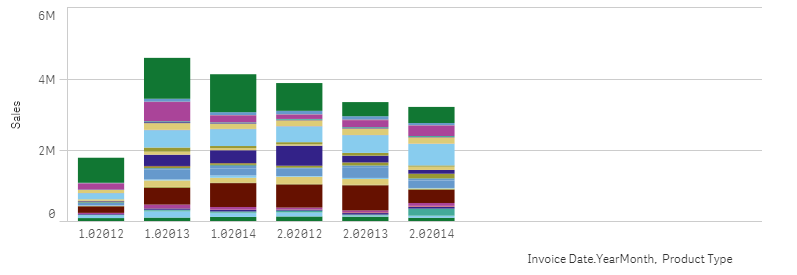
Kindly suggest a solution if its possible to display the labels as before.
Thanks in advance!!
 Mauritz_SA
- Mark as New
- Bookmark
- Subscribe
- Mute
- Subscribe to RSS Feed
- Permalink
- Report Inappropriate Content
Hi Ash
I thought I would just add my 2 cents. In you Bar chart you can also add two dimensions, the one will be Group and the other one will be Bar. I just used it in one of my apps to show you how it works:
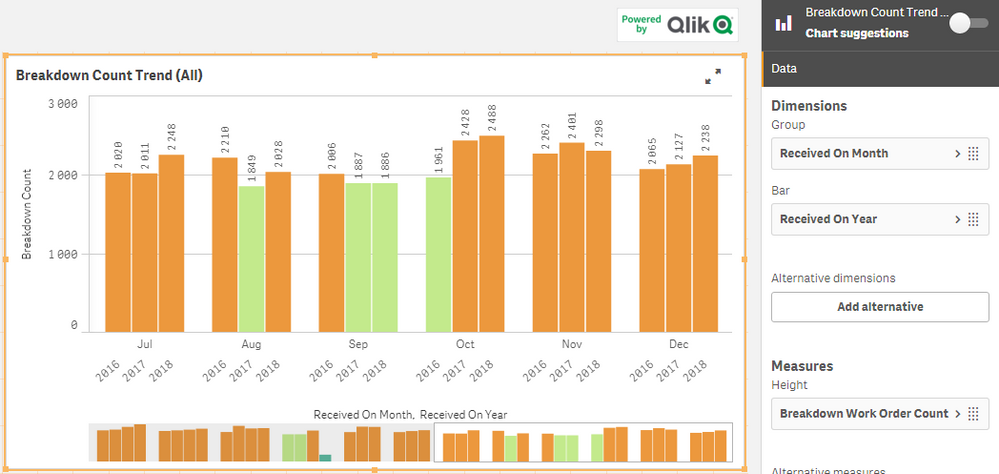
I just used the autocalendar year and month for the dimensions.
Good luck,
Mauritz
FlAsh92
- Mark as New
- Bookmark
- Subscribe
- Mute
- Subscribe to RSS Feed
- Permalink
- Report Inappropriate Content
hey @Mauritz_SA ,
thanks for that reply!!
But if you can see my graph, I'm already using 2 dimensions. One is Year-Month and the other is Product Type. So, when I split Year and Month, it becomes 3 dimensions...which is not viable for Bar Graph.
lironbaram
- Mark as New
- Bookmark
- Subscribe
- Mute
- Subscribe to RSS Feed
- Permalink
- Report Inappropriate Content
hi
why did you change the dimension
you just need to use this expression under the sort option of the dimension
so go back to your basic dimension , and under the sort settings select the option to sort by expression
lironbaram
- Mark as New
- Bookmark
- Subscribe
- Mute
- Subscribe to RSS Feed
- Permalink
- Report Inappropriate Content
why did you change the dimension
you just need to use this expression under the sort option of the dimension
so go back to your basic dimension , and under the sort settings select the option to sort by expression
Mauritz_SA
- Mark as New
- Bookmark
- Subscribe
- Mute
- Subscribe to RSS Feed
- Permalink
- Report Inappropriate Content
Hi Ash
Sorry, I didn't read properly  . What @lironbaram said in the next post will work (using it to sort the original dimension).
Regards,
Mauritz
FlAsh92
- Mark as New
- Bookmark
- Subscribe
- Mute
- Subscribe to RSS Feed
- Permalink
- Report Inappropriate Content
@lironbaram thanks buddy!!
Worked perfectly!!
 VisualUK
- Mark as New
- Bookmark
- Subscribe
- Mute
- Subscribe to RSS Feed
- Permalink
- Report Inappropriate Content
hi
I am actually trying to do the same thing, but unable to find a solution. Completely new to QV and learning as i go.
My dimension is: date(Monthname([CAT.Created]),'MMM')
My Expression is: Count({1<CAT_Ticket_ID>}CAT_Ticket_ID) - cannot be impacted by other user's selections
Dimension sort added is: num(month(CAT.Created)) + year(CAT.Created)/100000
I am getting the following bar chart.
- Jan, Feb, Mar (2018) || Jan, Feb, Mar, ... (2019) || Jan, Feb, Mar.... (2020)
What i would like seeing is:
- Jan '18, Jan '19, Jan'20 || Feb'18, Feb'19, Feb '20... and so on
any help highly appreciated...
