Unlock a world of possibilities! Login now and discover the exclusive benefits awaiting you.

- Qlik Community
- :
- Forums
- :
- Analytics & AI
- :
- Products & Topics
- :
- Visualization and Usability
- :
- Re: Growth Rate
- Subscribe to RSS Feed
- Mark Topic as New
- Mark Topic as Read
- Float this Topic for Current User
- Bookmark
- Subscribe
- Mute
- Printer Friendly Page

- Mark as New
- Bookmark
- Subscribe
- Mute
- Subscribe to RSS Feed
- Permalink
- Report Inappropriate Content
Growth Rate
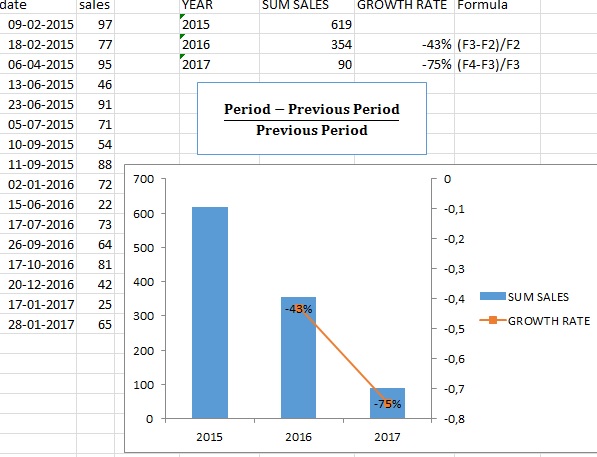
I need an expression that returns de growth rate in QLIK SENSE combo chart. the expression must be connected to the Date and sales table.
I´m going to show an example:
- Tags:
- growth rate
Accepted Solutions
- Mark as New
- Bookmark
- Subscribe
- Mute
- Subscribe to RSS Feed
- Permalink
- Report Inappropriate Content
thanks to both of you

 sunny_talwar
- Mark as New
- Bookmark
- Subscribe
- Mute
- Subscribe to RSS Feed
- Permalink
- Report Inappropriate Content
May be like this
Sum(Sales)/Above(Sum(Sales)) - 1
- Mark as New
- Bookmark
- Subscribe
- Mute
- Subscribe to RSS Feed
- Permalink
- Report Inappropriate Content
No.
I have to use an expression that return the dates in date column to years (bar chart) and secondary axis is a line with an expression like the example in excel i have shown for growth rate.

 OmarBenSalem
- Mark as New
- Bookmark
- Subscribe
- Mute
- Subscribe to RSS Feed
- Permalink
- Report Inappropriate Content
It's exactly what stalwar1 proposed:
You should use a combined graph
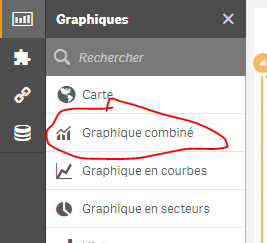
as dimension : Year
As measures:
1) Sum({<Year=>}sales)
2) (Sum({<Year=>}[sales])-above(Sum({<Year=>}[sales])))
/
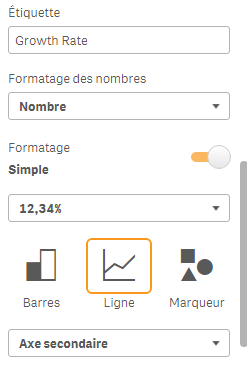
above(Sum({<Year=>}[sales])) : choose representation Line and it must be a secondary axis (format it as %):
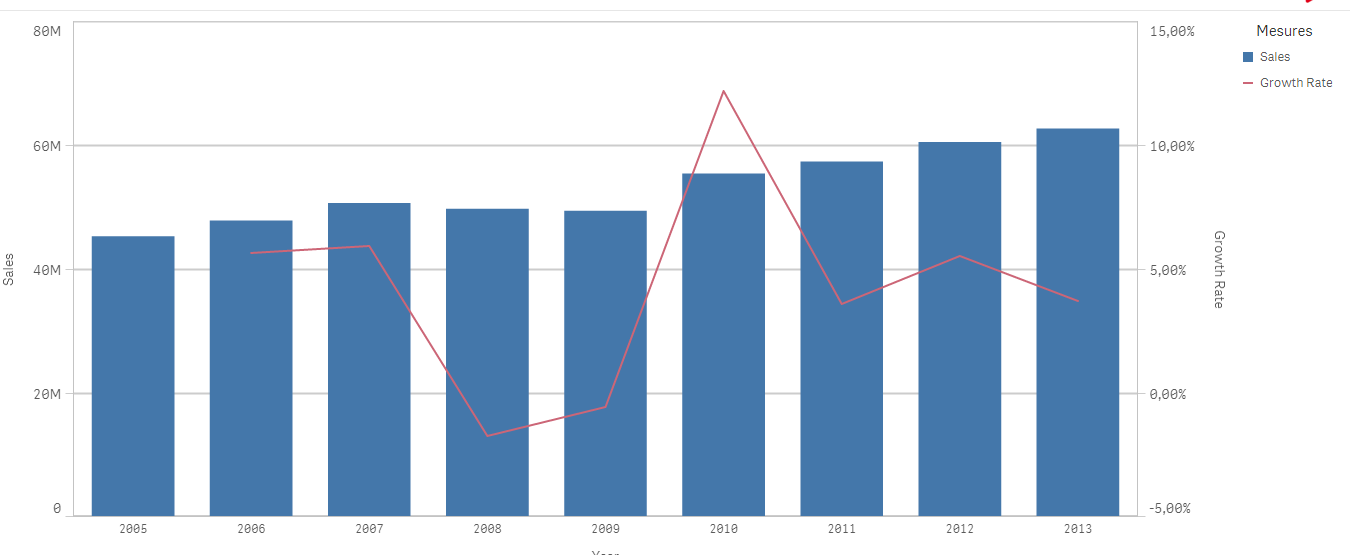
Result:
- Mark as New
- Bookmark
- Subscribe
- Mute
- Subscribe to RSS Feed
- Permalink
- Report Inappropriate Content
thanks to both of you
sunny_talwar
- Mark as New
- Bookmark
- Subscribe
- Mute
- Subscribe to RSS Feed
- Permalink
- Report Inappropriate Content
What is the point of marking a thank you response as a correct answer? Might as well leave it open....
- Mark as New
- Bookmark
- Subscribe
- Mute
- Subscribe to RSS Feed
- Permalink
- Report Inappropriate Content
I used the same expression to build a KPI showing the growth rate between 2015-2017, but the result was wrong.
(Sum({<Year={'2015'}>}[sales])-above(Sum({<Year={'2017'}>}[sales])))/above(Sum({<Year={'2017'}>}[sales]))
Can you help me?
OmarBenSalem
- Mark as New
- Bookmark
- Subscribe
- Mute
- Subscribe to RSS Feed
- Permalink
- Report Inappropriate Content
You should proceed as this:
1) measure 1 : Sum({<Year={"<=2017 >=2015"}>}sales)
2) (Sum({<Year={"<=2017 >=2015"}>}[sales])-above(Sum({<Year={"<=2017 >=2015"}>}[sales])))
/
above(Sum({<Year={"<=2017 >=2015"}>}[sales]))
OmarBenSalem
- Mark as New
- Bookmark
- Subscribe
- Mute
- Subscribe to RSS Feed
- Permalink
- Report Inappropriate Content
I misunderstood your KPI:
I thought you were using the graphic above and want to only see the years 2015 to 2017
Here's the expression if you want to compare 2017 % 2015:
(Sum({<Year={'2017'}>}sales)-Sum({<Year={'2015'}>}sales))
/
Sum({<Year={'2015'}>}sales)

 joanaleao
- Mark as New
- Bookmark
- Subscribe
- Mute
- Subscribe to RSS Feed
- Permalink
- Report Inappropriate Content
Hello,
is there a way to have a graph like this but with the possibility to select the years?
because with <Year=> user selection doesn't work and all the years are shown.
Thank you