Unlock a world of possibilities! Login now and discover the exclusive benefits awaiting you.

- Qlik Community
- :
- Forums
- :
- Analytics & AI
- :
- Products & Topics
- :
- Visualization and Usability
- :
- Re: Help creating table
- Subscribe to RSS Feed
- Mark Topic as New
- Mark Topic as Read
- Float this Topic for Current User
- Bookmark
- Subscribe
- Mute
- Printer Friendly Page

 rittermd
- Mark as New
- Bookmark
- Subscribe
- Mute
- Subscribe to RSS Feed
- Permalink
- Report Inappropriate Content
Help creating table
I'm sure that I need to do something in my script to get the data the way that I need it. But I just can't figure it out.
In my data I have 5 fields. Each contains a star rating from 1-5. I need to end up with a table that looks like this.
The numbers are the counts of facilities that have that value for that column.
I hope that this description makes sense.
Thanks.


- Mark as New
- Bookmark
- Subscribe
- Mute
- Subscribe to RSS Feed
- Permalink
- Report Inappropriate Content
Can you provide some sample data?
rittermd
- Mark as New
- Bookmark
- Subscribe
- Mute
- Subscribe to RSS Feed
- Permalink
- Report Inappropriate Content
The data is an excel spreadsheet.
A row would be for a facility id and then the 5 columns that you see in the file I attached. In each column there would be a value of 1-5.
For example:
4057 5 5 5 4 3
I have roughly 500 rows like this and I need to end up with a table that looks like the attached.
- Mark as New
- Bookmark
- Subscribe
- Mute
- Subscribe to RSS Feed
- Permalink
- Report Inappropriate Content
Make them 5 different images for stars and link them to rating value.
Use Bundle load to load them into QlikView.
Front end , under Straight table dimension take images & rating
- Mark as New
- Bookmark
- Subscribe
- Mute
- Subscribe to RSS Feed
- Permalink
- Report Inappropriate Content
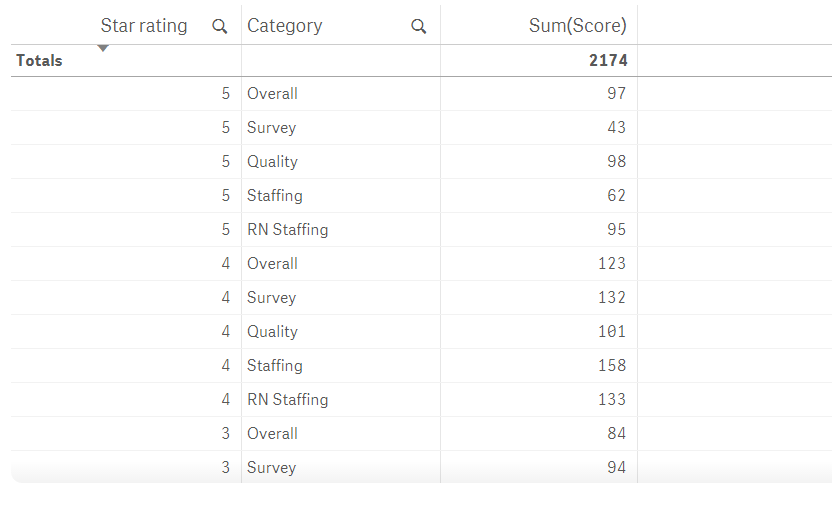
Assuming you're looking to display the data in straight tables, try using the CrossTable function in your load script. Crosstable ‒ Qlik Sense
Sample script using your numbers above, with the stars converted to numbers;
CrossTable(Category, Score)
LOAD * Inline [
Star rating,Overall,Survey,Quality,Staffing,RN Staffing
5,97,43,98,62,95
4,123,132,101,158,133
3,84,94,96,114,117
2,62,82,89,55,64
1,74,89,56,38,18];
and the table looks like this:

 jagan
jagan
- Mark as New
- Bookmark
- Subscribe
- Mute
- Subscribe to RSS Feed
- Permalink
- Report Inappropriate Content
HI,
You have to transform the data using CrossTable() like below
Data:
CrossTable(Category, Value)
LOAD
*
FROM ExcelFile;
Regards,
jagan.