Unlock a world of possibilities! Login now and discover the exclusive benefits awaiting you.
- Qlik Community
- :
- Forums
- :
- Analytics & AI
- :
- Products & Topics
- :
- Visualization and Usability
- :
- Re: High RAM/Memory issue on Qlik Sense server
- Subscribe to RSS Feed
- Mark Topic as New
- Mark Topic as Read
- Float this Topic for Current User
- Bookmark
- Subscribe
- Mute
- Printer Friendly Page
- Mark as New
- Bookmark
- Subscribe
- Mute
- Subscribe to RSS Feed
- Permalink
- Report Inappropriate Content
High RAM/Memory issue on Qlik Sense server
Hi All,
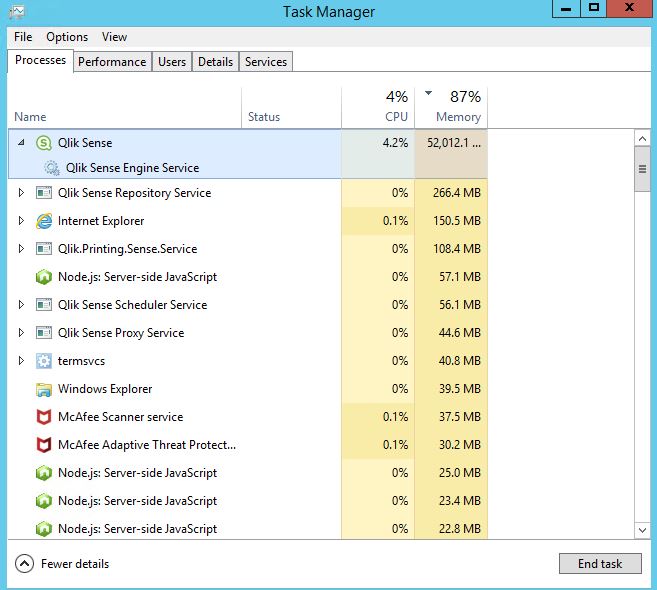
Need one help please. we have one Qlik view server [16 CPU, 64 GiB Memory]. This server is going down continuously. we checked the performance in Task manager. Qlik Service engine is consuming 99% memory. Please refer snapshot.
Also we did the memory settings as per the qlik installation document.
I already gone through different posts on this community where others users has same memory/high RAM issues. But it didn't helped to resolve this.
- « Previous Replies
-
- 1
- 2
- Next Replies »
- Mark as New
- Bookmark
- Subscribe
- Mute
- Subscribe to RSS Feed
- Permalink
- Report Inappropriate Content
- Mark as New
- Bookmark
- Subscribe
- Mute
- Subscribe to RSS Feed
- Permalink
- Report Inappropriate Content
Try to change Min and Max settings in QMC to (let's say) Min 30 and Max 50 and restart Qlik services.
- Mark as New
- Bookmark
- Subscribe
- Mute
- Subscribe to RSS Feed
- Permalink
- Report Inappropriate Content
Thanks for your reply. I changed that setting (30/50) but still getting high RAM/memory issues (upto 99%) which bring down Qlik Sense environment.
Any other suggestions please.
- Mark as New
- Bookmark
- Subscribe
- Mute
- Subscribe to RSS Feed
- Permalink
- Report Inappropriate Content
did you restart Qlik services after the change?
- Mark as New
- Bookmark
- Subscribe
- Mute
- Subscribe to RSS Feed
- Permalink
- Report Inappropriate Content
Hi,
This is standard Sense behaviour.
As the users select the apps to view, they get loaded into RAM. Then as they click around, user cache is created which is also stored in RAM. This usage is shown as RAM being held by the Engine service.
Any development work going on will also add to this usage.
Find out what apps are open, and how many users are currently accessing them (The operations monitor will show this detail).
The simple answer may well be that you need more RAM in the server to keep up with current usage.
Thanks,
Simon
- Mark as New
- Bookmark
- Subscribe
- Mute
- Subscribe to RSS Feed
- Permalink
- Report Inappropriate Content
Thanks for your reply. Yes i already restarted services and servers also. But still memory consumption is going to 95%+.
- Mark as New
- Bookmark
- Subscribe
- Mute
- Subscribe to RSS Feed
- Permalink
- Report Inappropriate Content
Thanks Simon for your reply. Actually initially memory was 8 GB and we added more memory. Currently this server has 16 CPU and 64 GB memory. But still memory consumption is going to 95%.
Anyways let me check the operations monitor option which you suggested.
Thanks again for your help.
- Mark as New
- Bookmark
- Subscribe
- Mute
- Subscribe to RSS Feed
- Permalink
- Report Inappropriate Content
Hi Ashwin,
please check which app is consuming more memory or else its very difficult to trace.
In ideal scenario we have to perform server sizing activity before developing APP's. In QLIKSENSE Engine memory utilization is on higher side because of IN-MEMORY concept.
Please check below area before publishing any APP to all business user.
- Is app is design as per QLIK Standard for e.g modelling of QVD's is major factor in QLIK?
- Is any third party extension is causing memory issue? as per best practice you have to use QLIK Sense Extension or QLIKSENSE supported extension in your app's?
- Please use QLIKSENSE scalability tool for performance testing before golive.
- Also check what is the frequency of Monitoring APP's task by default it was hourly please change it to Daily as per your H/W.
You can use monitoring tool to validate the stats w.r.t memory utilization as well as app responsible.
Please refer this article as well
How much RAM is consumed per application ?
https://support.qlik.com/articles/000058871
I hope this will help.
Regards,
Daya Jha
- Mark as New
- Bookmark
- Subscribe
- Mute
- Subscribe to RSS Feed
- Permalink
- Report Inappropriate Content
With the help of the telemetry dashboard you will determine which application is taking a long time to load and uses a lot of RAM. Duplicate problematic application through QMC > Apps, rename it to old application and upload data.
- « Previous Replies
-
- 1
- 2
- Next Replies »