Unlock a world of possibilities! Login now and discover the exclusive benefits awaiting you.
Announcements
Qlik Open Lakehouse is Now Generally Available! Discover the key highlights and partner resources here.
- Qlik Community
- :
- Forums
- :
- Analytics
- :
- Topics
- :
- Visualization and Usability
- :
- Histogram X axis displaying time number instead of...
Options
- Subscribe to RSS Feed
- Mark Topic as New
- Mark Topic as Read
- Float this Topic for Current User
- Bookmark
- Subscribe
- Mute
- Printer Friendly Page
Turn on suggestions
Auto-suggest helps you quickly narrow down your search results by suggesting possible matches as you type.
Showing results for
Partner - Contributor
2022-11-07
09:40 AM
- Mark as New
- Bookmark
- Subscribe
- Mute
- Subscribe to RSS Feed
- Permalink
- Report Inappropriate Content
Histogram X axis displaying time number instead of time format
Hello there
I have a dataset with HoraLog column. This column have some pre transformed data using Time() function and can be seen in this first image

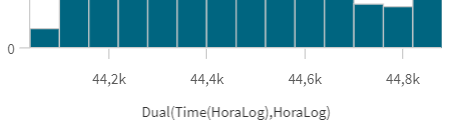
I am trying to build a histogram graphic with this dataset, and it works by the first sight. My issue is with the x axis, which is displaying the time number from Qlik instead the time format that we understand, as the following image.

Either if I use just HoraLog or this Dual function, both returns the same result.
I want this histogram to be just as it is but displaying using time format instead.
748 Views
0 Replies
Community Browser