Unlock a world of possibilities! Login now and discover the exclusive benefits awaiting you.

Announcements
Want to see what's currently in public preview? We've pulled it all together in one place. Check it out here
- Qlik Community
- :
- Forums
- :
- Analytics & AI
- :
- Products & Topics
- :
- Visualization and Usability
- :
- How let I start a combo chart from zero?
Options
- Subscribe to RSS Feed
- Mark Topic as New
- Mark Topic as Read
- Float this Topic for Current User
- Bookmark
- Subscribe
- Mute
- Printer Friendly Page
Turn on suggestions
Auto-suggest helps you quickly narrow down your search results by suggesting possible matches as you type.
Showing results for

Anonymous
Not applicable
2017-12-29
05:04 AM
- Mark as New
- Bookmark
- Subscribe
- Mute
- Subscribe to RSS Feed
- Permalink
- Report Inappropriate Content
How let I start a combo chart from zero?
Hi all,
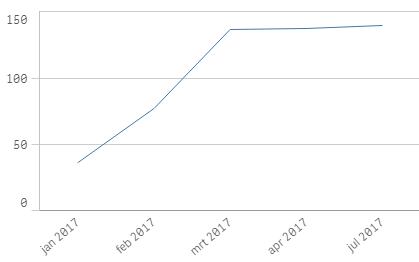
I made a combo chart which plots several points(see image), however I want this chart to always start at zero.
How can I make this happen?
1,213 Views
3 Replies

 sunny_talwar
MVP
2017-12-29
11:33 AM
- Mark as New
- Bookmark
- Subscribe
- Mute
- Subscribe to RSS Feed
- Permalink
- Report Inappropriate Content
Would you be able to share a sample to look at this?
954 Views
Anonymous
Not applicable
2017-12-29
11:43 AM
Author
- Mark as New
- Bookmark
- Subscribe
- Mute
- Subscribe to RSS Feed
- Permalink
- Report Inappropriate Content
In the Properties Panel, Appearance | Y-Axis: YourMeasure
- Set Range to Custom
- Then below set to Min
- Enter 0 for Min

 martinpohl
Partner - Master
2017-12-29
11:55 AM
- Mark as New
- Bookmark
- Subscribe
- Mute
- Subscribe to RSS Feed
- Permalink
- Report Inappropriate Content
I'm not sure about your request.
For example datas:
Jan 2017 30
Feb 2017 70
Mar 2017 100
So you want to see:
Jan 2017 0
Feb 2017 40 (70-30)
Mar 2017 70 (100-70)
Am I right?
So set your Expression to
sum(value) - top(sum(value))
Regards
954 Views