Unlock a world of possibilities! Login now and discover the exclusive benefits awaiting you.
- Qlik Community
- :
- Forums
- :
- Analytics & AI
- :
- Products & Topics
- :
- Visualization and Usability
- :
- How to add column in pivot table
- Subscribe to RSS Feed
- Mark Topic as New
- Mark Topic as Read
- Float this Topic for Current User
- Bookmark
- Subscribe
- Mute
- Printer Friendly Page
- Mark as New
- Bookmark
- Subscribe
- Mute
- Subscribe to RSS Feed
- Permalink
- Report Inappropriate Content
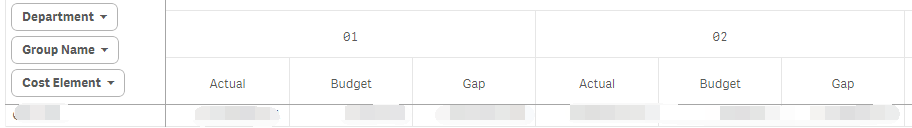
How to add column in pivot table
I need add a column after 02, named (total actual, total budget, total gap) to show total number of Actual (actual01+actual02) , total number of Budget (Budget01+Budget02) and total number of Gap (Gap01+Gap02)
How can i come true this? Thanks.
Accepted Solutions
- Mark as New
- Bookmark
- Subscribe
- Mute
- Subscribe to RSS Feed
- Permalink
- Report Inappropriate Content
You can add an extra field to your data model for the dimension (Group Name?) whose data values are on the top showing 01 , 02 etc... as dimension values.
Open the data load editor and do something like the following to create the new field:
//this will associate all groups with themselves.
Table:
Load
[Group Name],
[Group Name] as [Group Name with Totals]
resident <>
//this will ALSO associate all groups with a new value called Total. So the measures will show totals for all values
concatenate (Table)
Load
[Group Name],
'Total' as [Group Name with Totals]
resident <>
Then add [Group Name with Totals] to the chart to replace Group Name.
It should open up a new column.
- Mark as New
- Bookmark
- Subscribe
- Mute
- Subscribe to RSS Feed
- Permalink
- Report Inappropriate Content
I recommend you rather use the table chart and specify 9 expressions or use the SmartReporting extension found on branch.qlik.com
http://branch.qlik.com/projects/showthread.php?609-SmartReporting&highlight=smart
- Mark as New
- Bookmark
- Subscribe
- Mute
- Subscribe to RSS Feed
- Permalink
- Report Inappropriate Content
Hi,
There is no feature in qlik sense to add the total column at right most.
You can create two more expressions but it will show near 01 & 02.
- Mark as New
- Bookmark
- Subscribe
- Mute
- Subscribe to RSS Feed
- Permalink
- Report Inappropriate Content
Hi Batter,
The only way to create this is to add an other dimension value to the the set of 01,02 and totals(new field) and this new field total displays 3 other colums like the total actuals, total budget and total gap which are based on the calculations you needed.
Or go with a custom visualization which provides the totals row wise.
- Mark as New
- Bookmark
- Subscribe
- Mute
- Subscribe to RSS Feed
- Permalink
- Report Inappropriate Content
You can add an extra field to your data model for the dimension (Group Name?) whose data values are on the top showing 01 , 02 etc... as dimension values.
Open the data load editor and do something like the following to create the new field:
//this will associate all groups with themselves.
Table:
Load
[Group Name],
[Group Name] as [Group Name with Totals]
resident <>
//this will ALSO associate all groups with a new value called Total. So the measures will show totals for all values
concatenate (Table)
Load
[Group Name],
'Total' as [Group Name with Totals]
resident <>
Then add [Group Name with Totals] to the chart to replace Group Name.
It should open up a new column.
- Mark as New
- Bookmark
- Subscribe
- Mute
- Subscribe to RSS Feed
- Permalink
- Report Inappropriate Content
Thanks very much, it works. But when I change the select of the month the total value will not change, right?
- Mark as New
- Bookmark
- Subscribe
- Mute
- Subscribe to RSS Feed
- Permalink
- Report Inappropriate Content
The total (like everything else) should be filtered down to whatever current selections you have
- Mark as New
- Bookmark
- Subscribe
- Mute
- Subscribe to RSS Feed
- Permalink
- Report Inappropriate Content
Got it. Thanks. It changes now then I selected some months.