Unlock a world of possibilities! Login now and discover the exclusive benefits awaiting you.
- Qlik Community
- :
- Forums
- :
- Analytics & AI
- :
- Products & Topics
- :
- Visualization and Usability
- :
- Re: How to create bar graph for "Rolling 12 months...
- Subscribe to RSS Feed
- Mark Topic as New
- Mark Topic as Read
- Float this Topic for Current User
- Bookmark
- Subscribe
- Mute
- Printer Friendly Page
- Mark as New
- Bookmark
- Subscribe
- Mute
- Subscribe to RSS Feed
- Permalink
- Report Inappropriate Content
How to create bar graph for "Rolling 12 months data excluding current ongoing month?
Hello All,
I am trying to create bar graph for "Rolling 12 months data excluding current ongoing month" and i have an expression set in master item but the output includes data from current month also. Below is the expression -
COUNT(
{
1<[Created On Dt]={'>=$(=Monthstart(Addmonths(Max([Created On Dt]),-12)))<=$(=Max([Created On Dt]))'}>
}
IF(ISNULL(Id),0,1)
)
P.S. - I am completely new in this Qlik sense world! Any help with simple explanation will be appreciated.
- Mark as New
- Bookmark
- Subscribe
- Mute
- Subscribe to RSS Feed
- Permalink
- Report Inappropriate Content
So Max([Created On Dt]) will always give you the latest date in your data (which I assume is equivalent to the current month)
Using MonthEnd(Max([Created On Dt]),-1) means you're calculating up to the last day of the month before the current one.
e.g.:
Max([Created On Dt]) = 15/08/2018
MonthEnd(Max([Created On Dt]),-1) = 31/07/2018
COUNT(
{
1<[Created On Dt]={'>=$(=Monthstart(Addmonths(Max([Created On Dt]),-12)))<=$(=Monthend(Max([Created On Dt]),-1))'}>
}
IF(ISNULL(Id),0,1)
)
- Mark as New
- Bookmark
- Subscribe
- Mute
- Subscribe to RSS Feed
- Permalink
- Report Inappropriate Content
why you are using count
I think if you want to make a graph your dim would be something like William explained
only({1<[Created On Dt]={'>=$(=Monthstart(Addmonths(Max([Created On Dt]),-12)))<=$(=Monthend(Max([Created On Dt]),-1))'}>}Created On Dt)
- Mark as New
- Bookmark
- Subscribe
- Mute
- Subscribe to RSS Feed
- Permalink
- Report Inappropriate Content
Thank you William, it worked!
But then i tried to change colors in stacked bar graph and then x-axis is showing me extra data points which is not required.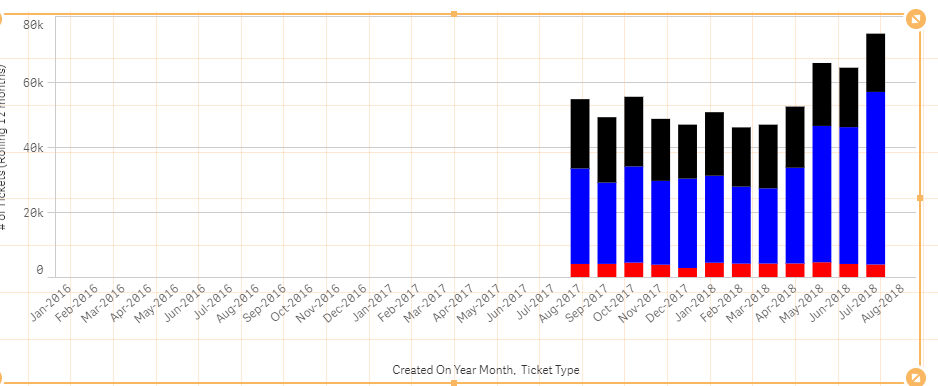 .
.
Can you please help?
- Mark as New
- Bookmark
- Subscribe
- Mute
- Subscribe to RSS Feed
- Permalink
- Report Inappropriate Content
Any help please?