Unlock a world of possibilities! Login now and discover the exclusive benefits awaiting you.

- Qlik Community
- :
- Forums
- :
- Analytics & AI
- :
- Products & Topics
- :
- Visualization and Usability
- :
- Re: How to create continuous and dotted line graph...
- Subscribe to RSS Feed
- Mark Topic as New
- Mark Topic as Read
- Float this Topic for Current User
- Bookmark
- Subscribe
- Mute
- Printer Friendly Page

- Mark as New
- Bookmark
- Subscribe
- Mute
- Subscribe to RSS Feed
- Permalink
- Report Inappropriate Content
How to create continuous and dotted line graph together?
Hi All,
We have a requirement to show a line graph with dotted line in same line. Please find the attached screen shot. Is it possible to achieve?
Thanks
Anirban


 m_woolf
- Mark as New
- Bookmark
- Subscribe
- Mute
- Subscribe to RSS Feed
- Permalink
- Report Inappropriate Content
Maybe something like this in the expression's line style:
if(Date>today(),'<S2>')

 OmarBenSalem
- Mark as New
- Bookmark
- Subscribe
- Mute
- Subscribe to RSS Feed
- Permalink
- Report Inappropriate Content
Hi mw,
And in QlikSense? How such a thing would be possible? an alternative to "if(Date>today(),'<S2>')" ?
The only forecast I could do (in Qlik Sense) if I don't use the forecast function of the R extension is as follow:
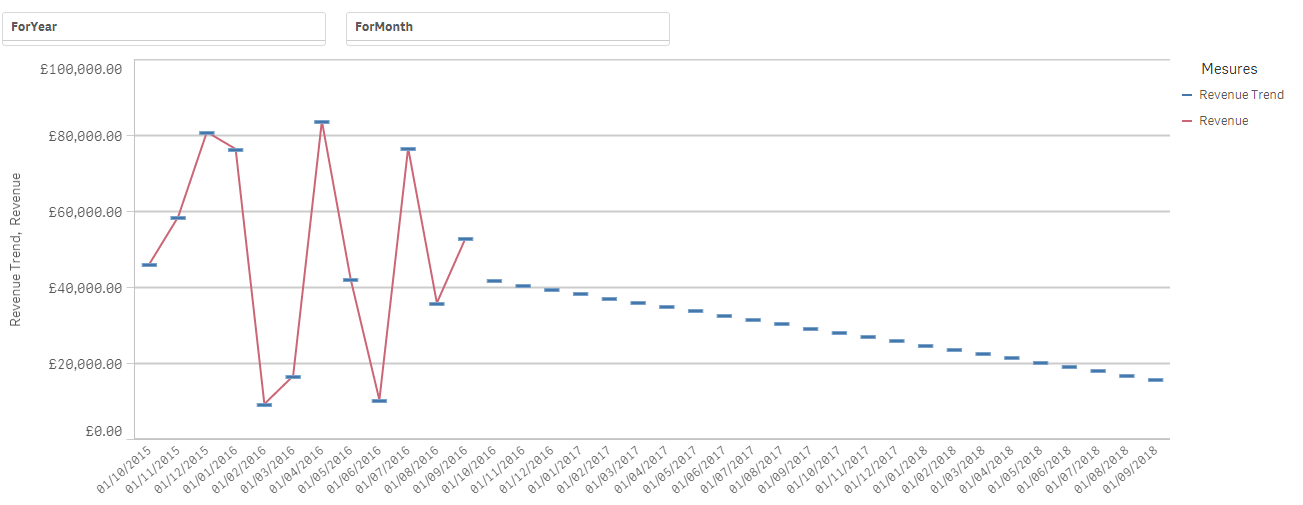
With the trend expression created by using a combination of linest
_m and linest_b functions.
If you know aother to atain 'forecasting' in Qlik Sense, please share !
Thanks,
m_woolf
- Mark as New
- Bookmark
- Subscribe
- Mute
- Subscribe to RSS Feed
- Permalink
- Report Inappropriate Content
I didn't notice the QlikSense categorization - my post was about QlikView.