Unlock a world of possibilities! Login now and discover the exclusive benefits awaiting you.
- Qlik Community
- :
- Forums
- :
- Analytics & AI
- :
- Products & Topics
- :
- Visualization and Usability
- :
- Re: How to find top 3
- Subscribe to RSS Feed
- Mark Topic as New
- Mark Topic as Read
- Float this Topic for Current User
- Bookmark
- Subscribe
- Mute
- Printer Friendly Page
- Mark as New
- Bookmark
- Subscribe
- Mute
- Subscribe to RSS Feed
- Permalink
- Report Inappropriate Content
How to find top 3
I have an expression like sum(sales)/count(distinct transactions).
How can I show top 3 salesmen?
That chart is better to use?
Can I use 3 KPI charts each if them showing first, second and third place respectively as well as a trend from last week?
Thank you for you time in advance!
Accepted Solutions
- Mark as New
- Bookmark
- Subscribe
- Mute
- Subscribe to RSS Feed
- Permalink
- Report Inappropriate Content
Hi Evgeniy
Add a bar chart to one of your sheet
Add salesmen as dimension and sum(sales)/count(distinct transactions) as mesure
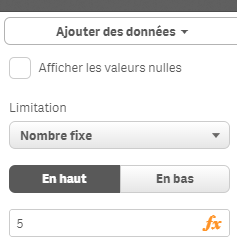
Then in the panel menu of the bar chart
in the dimension salesmen put LIMITATION to 3 to get only the TOP 3 salesmen
Hope it helps you
Bruno
- Mark as New
- Bookmark
- Subscribe
- Mute
- Subscribe to RSS Feed
- Permalink
- Report Inappropriate Content
Can you share some sample data with your expected output?
- Mark as New
- Bookmark
- Subscribe
- Mute
- Subscribe to RSS Feed
- Permalink
- Report Inappropriate Content
I'm sorry I can't, just imagine smth like that:
Jonny
Transaction 1 sales 342
Transaction 2 sales 563
Transaction 3 sales 3423
Transaction 4 sales 4033
Peter
Transaction 1 sales 434
Transaction 2 sales 003
Transaction 3 sales 3443
Transaction 4 sales 9433
Transaction 5 sales 23
Fred
Transaction 1 sales 32020
Transaction 2 sales 291
- Mark as New
- Bookmark
- Subscribe
- Mute
- Subscribe to RSS Feed
- Permalink
- Report Inappropriate Content
Hi Evgeniy
Add a bar chart to one of your sheet
Add salesmen as dimension and sum(sales)/count(distinct transactions) as mesure
Then in the panel menu of the bar chart
in the dimension salesmen put LIMITATION to 3 to get only the TOP 3 salesmen
Hope it helps you
Bruno
- Mark as New
- Bookmark
- Subscribe
- Mute
- Subscribe to RSS Feed
- Permalink
- Report Inappropriate Content
Bruno, thank you! It helps in one way, but how can I display each of top 3 guys in different KPI chart?