Unlock a world of possibilities! Login now and discover the exclusive benefits awaiting you.
- Qlik Community
- :
- Forums
- :
- Analytics & AI
- :
- Products & Topics
- :
- Visualization and Usability
- :
- Re: How to get multiple excel columns in one pie c...
- Subscribe to RSS Feed
- Mark Topic as New
- Mark Topic as Read
- Float this Topic for Current User
- Bookmark
- Subscribe
- Mute
- Printer Friendly Page
- Mark as New
- Bookmark
- Subscribe
- Mute
- Subscribe to RSS Feed
- Permalink
- Report Inappropriate Content
How to get multiple excel columns in one pie chart
Hi,
I've got a question for you guys.
I want to have multiple excel columns in one pie chart.
My data is:
| Standard | Red | Yellow | Green |
|---|---|---|---|
| AA01 | 1 | 2 | 3 |
| AA02 | 2 | 3 | 1 |
| AA03 | 0 | 2 | 6 |
| AA04 | 3 | 0 | 0 |
With a filter I want to select the Standard.
Hope you can help me
Accepted Solutions
- Mark as New
- Bookmark
- Subscribe
- Mute
- Subscribe to RSS Feed
- Permalink
- Report Inappropriate Content
- Mark as New
- Bookmark
- Subscribe
- Mute
- Subscribe to RSS Feed
- Permalink
- Report Inappropriate Content
Hi Bas,
As variant, may be as in attached file.
Regards,
Andrey
- Mark as New
- Bookmark
- Subscribe
- Mute
- Subscribe to RSS Feed
- Permalink
- Report Inappropriate Content
Hi Bas,
pleas check my attached example,
i hope that helps
Beck
- Mark as New
- Bookmark
- Subscribe
- Mute
- Subscribe to RSS Feed
- Permalink
- Report Inappropriate Content
Bags,
check this:
1.https://www.youtube.com/watch?v=xkBFyNys1LI
2.Cross Table in QlikView - YouTube
it is about function in script: CrossTable, with that you can resolve such problems
i hope that helps
Beck
- Mark as New
- Bookmark
- Subscribe
- Mute
- Subscribe to RSS Feed
- Permalink
- Report Inappropriate Content
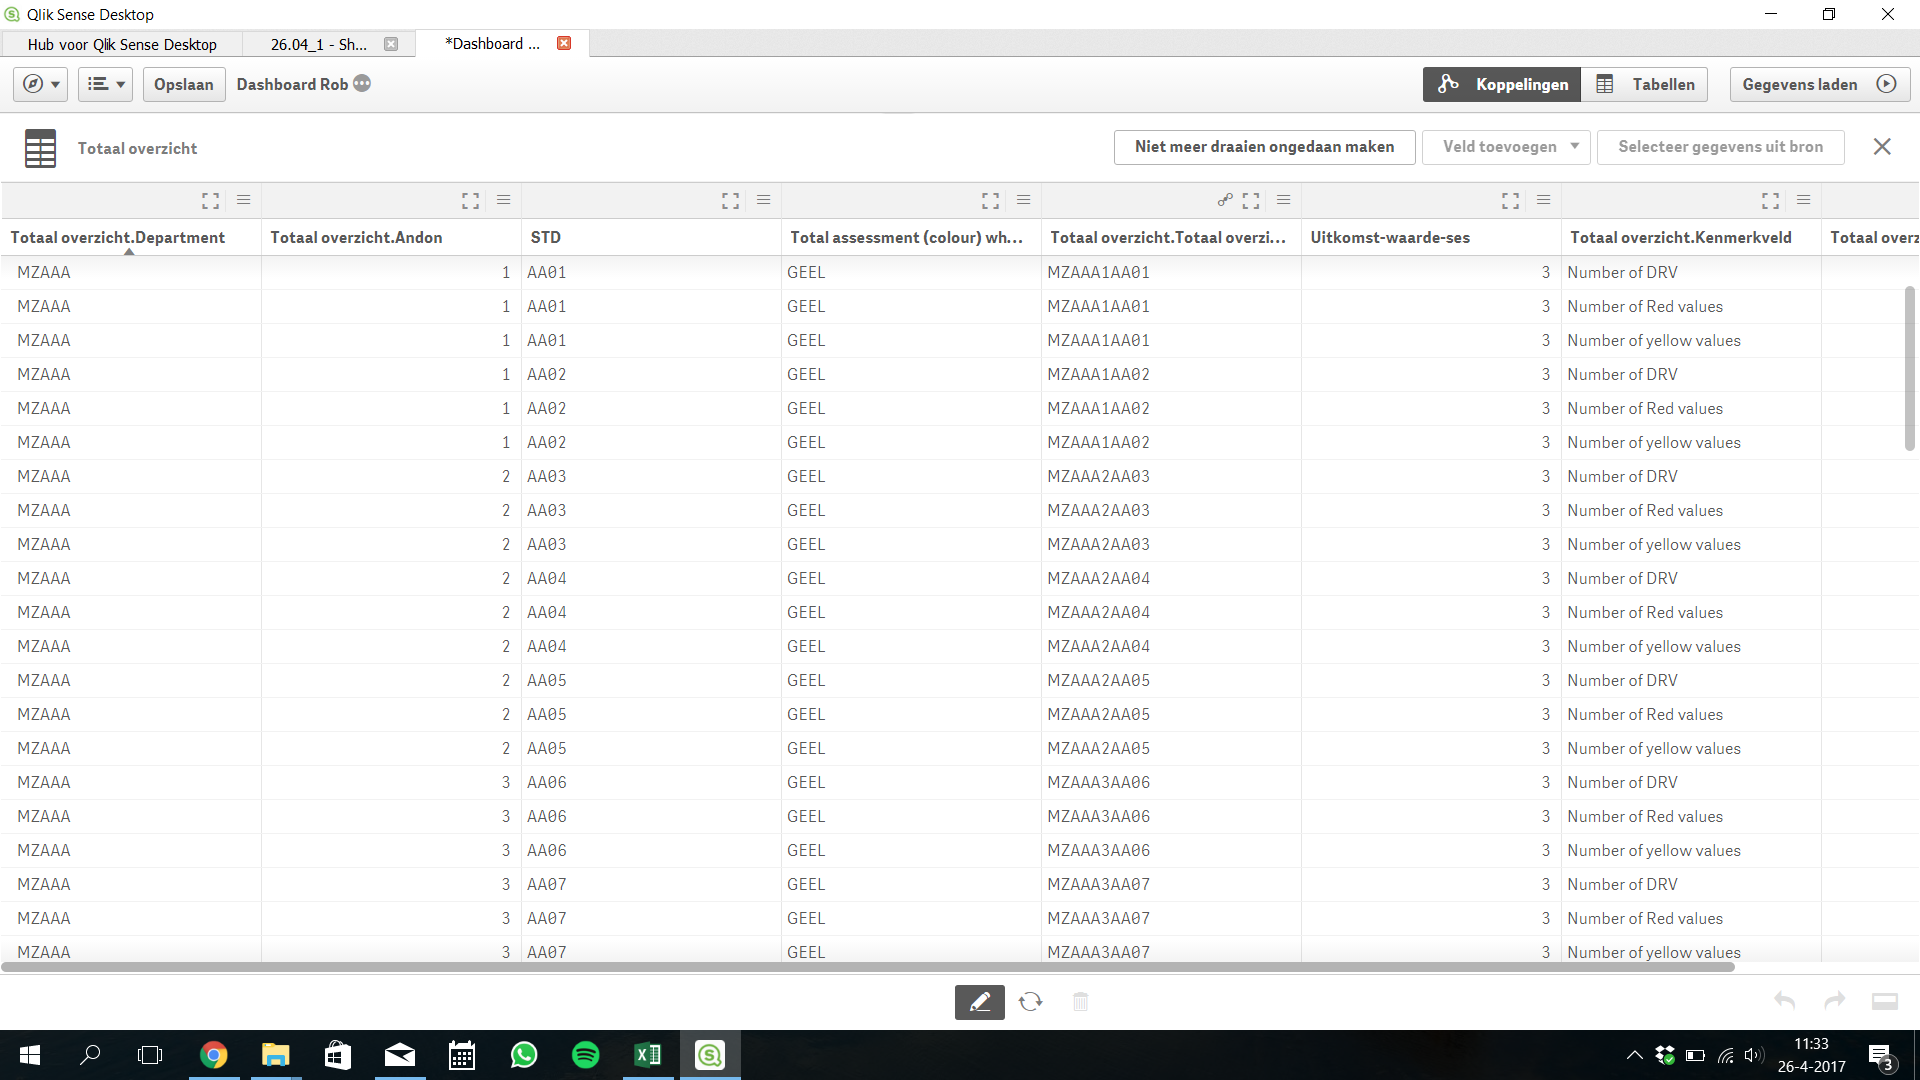
Thanks Andrey that is what I needed.
Did you reform the data to get it?
Because I have in total 300 standards
- Mark as New
- Bookmark
- Subscribe
- Mute
- Subscribe to RSS Feed
- Permalink
- Report Inappropriate Content
Hi Andrey,
I fixed my first problem with your solution.
But it created a new one. I also have pie charts for the standards and total assesment.
Is their a function where it filters the STD back to one? something like distinct?

Regards Bas