Unlock a world of possibilities! Login now and discover the exclusive benefits awaiting you.
- Qlik Community
- :
- Forums
- :
- Analytics & AI
- :
- Products & Topics
- :
- Visualization and Usability
- :
- How to have only specifics components of field sho...
- Subscribe to RSS Feed
- Mark Topic as New
- Mark Topic as Read
- Float this Topic for Current User
- Bookmark
- Subscribe
- Mute
- Printer Friendly Page
- Mark as New
- Bookmark
- Subscribe
- Mute
- Subscribe to RSS Feed
- Permalink
- Report Inappropriate Content
How to have only specifics components of field show on table?
Hello,
I was wondering if there was a formula to show only specific components of a field? I wish to have a table only show certain specific values from a field, instead of every value available in the field. Please see screenshot below to see what I mean:
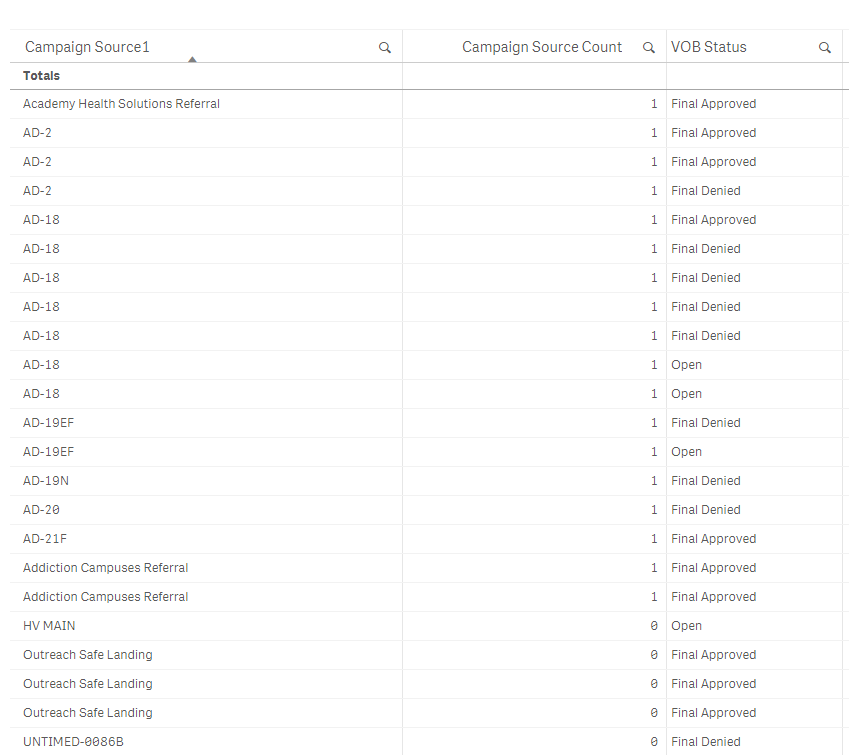
In the table above, what formula can I use for the table to show only "AD-18" and "AD-20" ? I wish to have the table only present those two names in the Campaign Source1 column, WITHOUT having to choose them by clicking. Is there a formula or function to do this? I tried "ValueList" but that is apparently incorrect.
Thank you in advance for your assistance!
- Tags:
- selected field
Accepted Solutions
- Mark as New
- Bookmark
- Subscribe
- Mute
- Subscribe to RSS Feed
- Permalink
- Report Inappropriate Content
Hi,
Method 1:
create Calculated dimension like below
pick(match( [Campaign Source1],'AD-18','AD-20'),'AD-18','AD-20')
suppress null value in this cal.dimension
Method 2:
if u wish to apply this logic to entire application, then try do it back end
Fact:
load * table where match( [Campaign Source1],'AD-18','AD-20');
Method 3:
using set analysis in your chart expression
count ( {$<[Campaign Source1]={'AD-18','AD-20'}>} distinct [Campaign Source1])
Hope this helps to you
Regards,
Deva
- Mark as New
- Bookmark
- Subscribe
- Mute
- Subscribe to RSS Feed
- Permalink
- Report Inappropriate Content
Replace the field Campaign Source Count with this measure:
=sum( {<[Campaign Source1]={'AD-18','AD-20'}>} [Campaign Source Count)
talk is cheap, supply exceeds demand
- Mark as New
- Bookmark
- Subscribe
- Mute
- Subscribe to RSS Feed
- Permalink
- Report Inappropriate Content
Hi,
Method 1:
create Calculated dimension like below
pick(match( [Campaign Source1],'AD-18','AD-20'),'AD-18','AD-20')
suppress null value in this cal.dimension
Method 2:
if u wish to apply this logic to entire application, then try do it back end
Fact:
load * table where match( [Campaign Source1],'AD-18','AD-20');
Method 3:
using set analysis in your chart expression
count ( {$<[Campaign Source1]={'AD-18','AD-20'}>} distinct [Campaign Source1])
Hope this helps to you
Regards,
Deva
- Mark as New
- Bookmark
- Subscribe
- Mute
- Subscribe to RSS Feed
- Permalink
- Report Inappropriate Content
Hello,
Thank you for the answer! It worked perfectly.
Is there a formula I can use that uses wildmatch? For instance, I wanna use all the names in the Campaign Source1 column to include only all the names that has "AD" ?
Thanks again!
- Mark as New
- Bookmark
- Subscribe
- Mute
- Subscribe to RSS Feed
- Permalink
- Report Inappropriate Content
Hi
Yes, try like below,
method 1:
count ( {$<[Campaign Source1]={"AD*"}>} distinct [Campaign Source1])
method 2:
load * table where Wildmatch( [Campaign Source1],'AD*');
method 3:
pick(Wildmatch( [Campaign Source1],'AD*'),[Campaign Source1])
Hope this helps to you 
Regards,
Deva
- Mark as New
- Bookmark
- Subscribe
- Mute
- Subscribe to RSS Feed
- Permalink
- Report Inappropriate Content
Thanks you so much!! That worked perfectly