Unlock a world of possibilities! Login now and discover the exclusive benefits awaiting you.
- Qlik Community
- :
- Forums
- :
- Analytics & AI
- :
- Products & Topics
- :
- Visualization and Usability
- :
- Re: How to load this data
- Subscribe to RSS Feed
- Mark Topic as New
- Mark Topic as Read
- Float this Topic for Current User
- Bookmark
- Subscribe
- Mute
- Printer Friendly Page
- Mark as New
- Bookmark
- Subscribe
- Mute
- Subscribe to RSS Feed
- Permalink
- Report Inappropriate Content
How to load this data
Hi everyone,
I am trying to figure out how to properly load this data. So I have these two sample tables to illustrate:
Sales (this is like a unit level table)
| Color | Month | Count | Group |
|---|---|---|---|
| Red | Jan | 10 | G1 |
| Red | Feb | 20 | G2 |
| Blue | Jan | 30 | G1 |
Target
| Color | Month | Target Count |
|---|---|---|
| Red | Jan | 50 |
| Red | Feb | 50 |
| Red | Mar | 50 |
| Blue | Jan | 50 |
Now, I want to display these in a pivot table as:
| Color | Month | Target (based on Color/Month) | Actual | Sum of Target (based on Month) | Actual |
|---|---|---|---|---|---|
| Red | Jan | 50 | 10 | 100 | 40 |
| Feb | 50 | 20 | 50 | 20 | |
| Mar | 50 | 0 | 50 | 0 | |
| Blue | Jan | 50 | 30 | 100 | 40 |
And If I do a filter on Group = G1, this is what should be displayed:
| Color | Month | Target (based on Color/Month) | Actual | Sum of Target (based on Month) | Actual |
|---|---|---|---|---|---|
| Red | Jan | 50 | 10 | 100 | 40 |
| Feb | 50 | 0 | 50 | 0 | |
| Mar | 50 | 0 | 50 | 0 | |
| Blue | Jan | 50 | 30 | 100 | 40 |
Thanks in advance!
Accepted Solutions
- Mark as New
- Bookmark
- Subscribe
- Mute
- Subscribe to RSS Feed
- Permalink
- Report Inappropriate Content
If you really do not want synthetic table, try this:
Sales:
Load
     Color,
     Month,
     Count,
     Group
Inline
[
Color,Month,Count,Group
Red,Jan,10,G1
Red,Feb,20,G2
Blue,Jan,30,G1
]
(Delimiter is ',');


Target:
Outer Join Load
     Color,
     Month,
     [Target Count]
Inline
[
Color,Month,Target Count
Red,Jan,50
Red,Feb,50
Red,Mar,50
Blue,Jan,50
]
(Delimiter is ',');
- Mark as New
- Bookmark
- Subscribe
- Mute
- Subscribe to RSS Feed
- Permalink
- Report Inappropriate Content
in Load script,
link both tables using composite key of Color and Month fields.
For Ex. Color &'-'& Month as Key.
This you will have to create in both tables (Sales & Target)
- Mark as New
- Bookmark
- Subscribe
- Mute
- Subscribe to RSS Feed
- Permalink
- Report Inappropriate Content
Hello! Load it like this, Qlik is going to automatically link the tables based on Color and Month:
Sales:
Load
     Color,
     Month,
     Count,
     Group
Inline
[
Color,Month,Count,Group
Red,Jan,10,G1
Red,Feb,20,G2
Blue,Jan,30,G1
]
(Delimiter is ',');


Target:
Load
     Color,
     Month,
     [Target Count]
Inline
[
Color,Month,Target Count
Red,Jan,50
Red,Feb,50
Red,Mar,50
Blue,Jan,50
]
(Delimiter is ',');
- Mark as New
- Bookmark
- Subscribe
- Mute
- Subscribe to RSS Feed
- Permalink
- Report Inappropriate Content
Thanks, but doing that will create a synthetic key, which can be solved by making a composite key.
The problem is, the "Red-March" comination is not in the Sales table, hence i cannot achieve this(emphasis on third row):
| Color | Month | Target (based on Color/Month) | Actual | Sum of Target (based on Month) | Actual |
|---|---|---|---|---|---|
| Red | Jan | 50 | 10 | 100 | 40 |
| Feb | 50 | 20 | 50 | 20 | |
| Mar | 50 | 0 | 50 | 0 | |
| Blue | Jan | 50 | 30 | 100 | 40 |
- Mark as New
- Bookmark
- Subscribe
- Mute
- Subscribe to RSS Feed
- Permalink
- Report Inappropriate Content
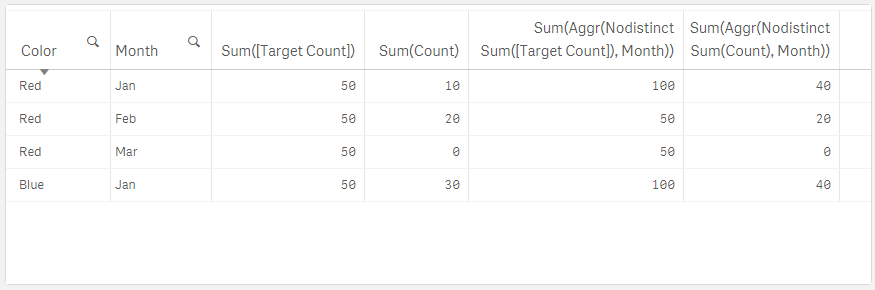
If you see a synthetic key in your data model and you did not expect it, then you most probably have a problem. If you know why it is there, you are good to go.
If you use the script that I posted you should be able to get the table in the format that you need it. Since there is no data for the combination Red-March, the Actual will show "-". You can avoid that by changing the expression, e.g. =If(Sum(Count)>0, Sum(Count), '0').
- Mark as New
- Bookmark
- Subscribe
- Mute
- Subscribe to RSS Feed
- Permalink
- Report Inappropriate Content
If you really do not want synthetic table, try this:
Sales:
Load
     Color,
     Month,
     Count,
     Group
Inline
[
Color,Month,Count,Group
Red,Jan,10,G1
Red,Feb,20,G2
Blue,Jan,30,G1
]
(Delimiter is ',');


Target:
Outer Join Load
     Color,
     Month,
     [Target Count]
Inline
[
Color,Month,Target Count
Red,Jan,50
Red,Feb,50
Red,Mar,50
Blue,Jan,50
]
(Delimiter is ',');
- Mark as New
- Bookmark
- Subscribe
- Mute
- Subscribe to RSS Feed
- Permalink
- Report Inappropriate Content
But then if I do a filter on group, example "G1", it will only display the Month "Jan".
- Mark as New
- Bookmark
- Subscribe
- Mute
- Subscribe to RSS Feed
- Permalink
- Report Inappropriate Content
TARGET_COUNT:
Load * Inline [
COLOR,MONTH,TARGET_COUNT
Red,Jan,50
Red,Feb,50
Red,Mar,50
Blue,Jan,50
];
LEFT JOIN
SALES:
Load * Inline [
COLOR,MONTH,COUNT,GROUP
Red,Jan,10,G1
Red,Feb,20,G2
Blue,Jan,30,G1
];
LOAD
MONTH,
SUM(COUNT) AS TOTAL_COUNT,
SUM(TARGET_COUNT) AS TOTAL_TARGET_COUNT
RESIDENT TARGET_COUNT
GROUP BY MONTH;
- Mark as New
- Bookmark
- Subscribe
- Mute
- Subscribe to RSS Feed
- Permalink
- Report Inappropriate Content
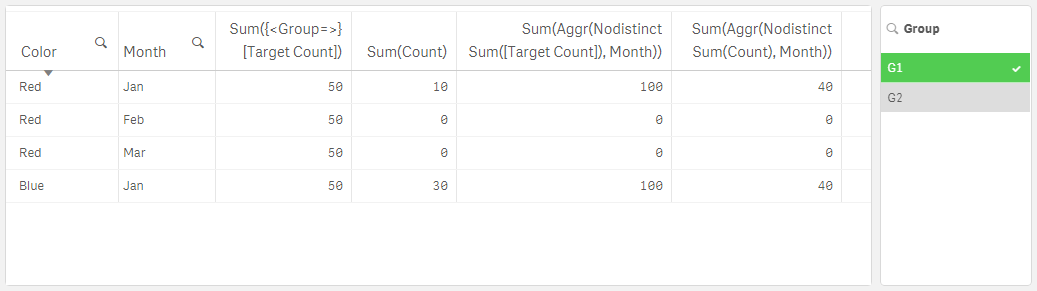
No problem, just add some set analysis, e.g.
Sum({<Group=>}[Target Count])