Unlock a world of possibilities! Login now and discover the exclusive benefits awaiting you.

- Qlik Community
- :
- Forums
- :
- Analytics & AI
- :
- Products & Topics
- :
- Visualization and Usability
- :
- Re: How to restrict the date values in Line chart ...
- Subscribe to RSS Feed
- Mark Topic as New
- Mark Topic as Read
- Float this Topic for Current User
- Bookmark
- Subscribe
- Mute
- Printer Friendly Page

- Mark as New
- Bookmark
- Subscribe
- Mute
- Subscribe to RSS Feed
- Permalink
- Report Inappropriate Content
How to restrict the date values in Line chart X axis
Hi,
I have d date field having values like Jan-16,Feb-16,Mar-16......................Sep17.
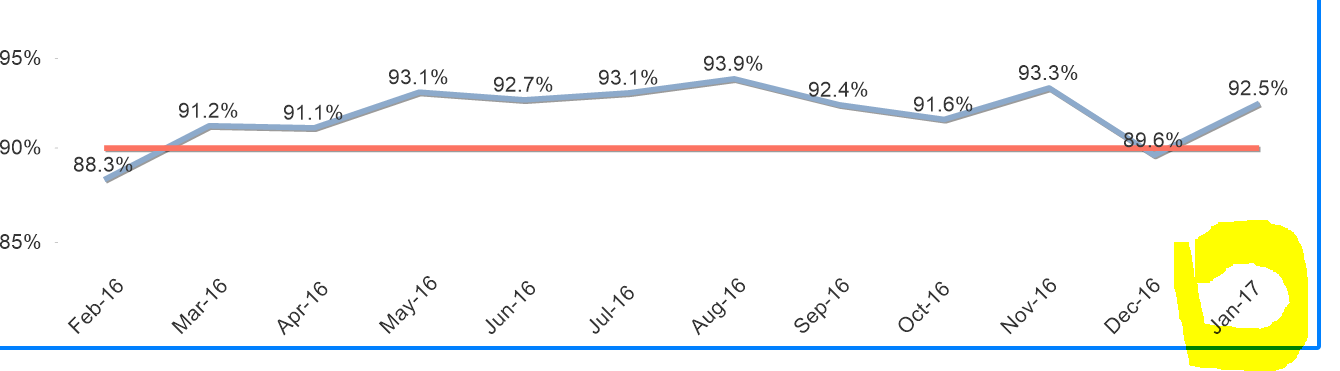
I want to display last 12 months of data in X-axis.
Ex: Current month is Feb 17, i have to show on x-axis from Jan-16 to Jan-17 only.
If Current month is Mar-17, i have to show data on x-axis from Feb-16 to Feb-17.
Can any one help on this requirement.
Thanks,
Ravi
Accepted Solutions

 sunny_talwar
- Mark as New
- Bookmark
- Subscribe
- Mute
- Subscribe to RSS Feed
- Permalink
- Report Inappropriate Content
This?
num(sum({<Surface={'Total Room'}, CalendarDate = {"$(='>=' & Date(AddYears(Max(CalendarDate), -1), 'MMM-YY') & '<=' & Date(Max(CalendarDate), 'MMM-YY'))"}>}Pass)/(sum({<Surface={'Total Room'}>}Fail)+ sum({<Surface={'Total Room'}>}Pass)+sum({<Surface={'Total Room'}>}Caution)),'#,##0.0%')

 shubham_singh
- Mark as New
- Bookmark
- Subscribe
- Mute
- Subscribe to RSS Feed
- Permalink
- Report Inappropriate Content
First create MonthSerial like this.
Year * 12 + Month
Here is how to do it in script
MonthMap:
Mapping LOAD * INLINE [
Name,Num
Jan,1
Feb,2
.
.
Dec,12
];
Assuming field name of d date is d_date
LOAD *,
ApplyMap('MonthMap',left(d_date,3)) + (right(d_date,2)*12) as MonthSerial
Then in expression of Measure use set analysis like this
Sum( {<MonthSerial={">=$(=max(MonthSerial)-12) <$(=max(MonthSerial))"}>} Sales)
- Mark as New
- Bookmark
- Subscribe
- Mute
- Subscribe to RSS Feed
- Permalink
- Report Inappropriate Content
Hi ,
Is there any way to restrict by using calculated dimension in the chart.
shubham_singh
- Mark as New
- Bookmark
- Subscribe
- Mute
- Subscribe to RSS Feed
- Permalink
- Report Inappropriate Content
You cannot use calculated dimension in Set Analysis and Set analysis is the only way you restrict data,
I'll need a sample app to do that without scripting.
- Mark as New
- Bookmark
- Subscribe
- Mute
- Subscribe to RSS Feed
- Permalink
- Report Inappropriate Content
sunny_talwar
- Mark as New
- Bookmark
- Subscribe
- Mute
- Subscribe to RSS Feed
- Permalink
- Report Inappropriate Content
This?
num(sum({<Surface={'Total Room'}, CalendarDate = {"$(='>=' & Date(AddYears(Max(CalendarDate), -1), 'MMM-YY') & '<=' & Date(Max(CalendarDate), 'MMM-YY'))"}>}Pass)/(sum({<Surface={'Total Room'}>}Fail)+ sum({<Surface={'Total Room'}>}Pass)+sum({<Surface={'Total Room'}>}Caution)),'#,##0.0%')
- Mark as New
- Bookmark
- Subscribe
- Mute
- Subscribe to RSS Feed
- Permalink
- Report Inappropriate Content
Thanks Sunny,
Its working.
- Mark as New
- Bookmark
- Subscribe
- Mute
- Subscribe to RSS Feed
- Permalink
- Report Inappropriate Content
Hi Sunny,
This expression is working for last 12 months.
I am having calendar dates from Jan-16 to Sep-17,so it is showing data for Oct-16 to Sep 17.
My requirement is ,it suppose to show Feb-16 to Jan-17.
If Calendar date is Mar-17 ,then my o/p is Mar-16 to Feb-17.
Can you help on this requirement.
Thanks,
Ravi
sunny_talwar
- Mark as New
- Bookmark
- Subscribe
- Mute
- Subscribe to RSS Feed
- Permalink
- Report Inappropriate Content
Calendar date is Jan-16 to Sep-17 and you want to see from Feb-16 to Jan-17? What is the logic here? Can you explain it?
- Mark as New
- Bookmark
- Subscribe
- Mute
- Subscribe to RSS Feed
- Permalink
- Report Inappropriate Content
My Chart always should show the data of last 12 Months.
Ex:Current month is Feb 17, so my chart should display data from Feb-16 to Jan-17.
If i reload the report in March-17, the chart must have data from Mar-16 to Feb-17.
If i reload the report in Apr-17,the chart must have data from Apr-16 to Mar-17.The highlighted month always be [Current month-1 ] and total months in the graph are 12.