Unlock a world of possibilities! Login now and discover the exclusive benefits awaiting you.
- Qlik Community
- :
- Forums
- :
- Analytics & AI
- :
- Products & Topics
- :
- Visualization and Usability
- :
- Invalid dimension
- Subscribe to RSS Feed
- Mark Topic as New
- Mark Topic as Read
- Float this Topic for Current User
- Bookmark
- Subscribe
- Mute
- Printer Friendly Page
- Mark as New
- Bookmark
- Subscribe
- Mute
- Subscribe to RSS Feed
- Permalink
- Report Inappropriate Content
Invalid dimension
Hello,
In a chart by year, I would automatically display the last 2 years if there are no active selections and otherwise it'll be necessary to display the year according to the active selection.
I tried the script below in the dimension but I get "Invalid dimension".
=IF(GetSelectedCount([YEAR)=0,ValueList(LAST_YEAR,LAST_TWO_YEARS),GetFieldSelections([YEAR]))
"LAST_YEAR" and "LAST_TWO_YEARS" are variables.
How can I please?
Thank you very much.
Accepted Solutions
- Mark as New
- Bookmark
- Subscribe
- Mute
- Subscribe to RSS Feed
- Permalink
- Report Inappropriate Content
Hello,
I am not 100% sure if I understood the exact use case scenario, however I would like to share with you my recommendation. You can take the idea behind the implementation and modify the expressions based on your needs. Keep in mind that there might be other ways to implement and get this outcome, but here is what worked for me:
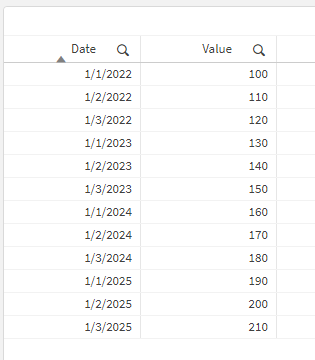
1. I have loaded the dataset:
2. The created a Bar chart with dimension expression:
=If(IsNull(GetFieldSelections(Date))=-1, If(Date>='1/1/$(=Year(Max(Date))-1)',Date,Null()), Date)
- This expression checks if there are any selections in the field "Date".
- If there are not any selections, then it will evaluate: If(Date>='1/1/$(=Year(Max(Date))-1)',Date,Null()). This part will create a date value that represents the first day of the previous year of the max date value found in the dataset. Hence, the last 2 years from the dataset. If date is grater then it will return it, otherwise it will return Null()
- In case the initial check is not null, it means that there are selections in the field, so just return the Date filed as it is. The applied selections will be reflected on the displayed values
- Also remove the option "Include null values"
Outcome:
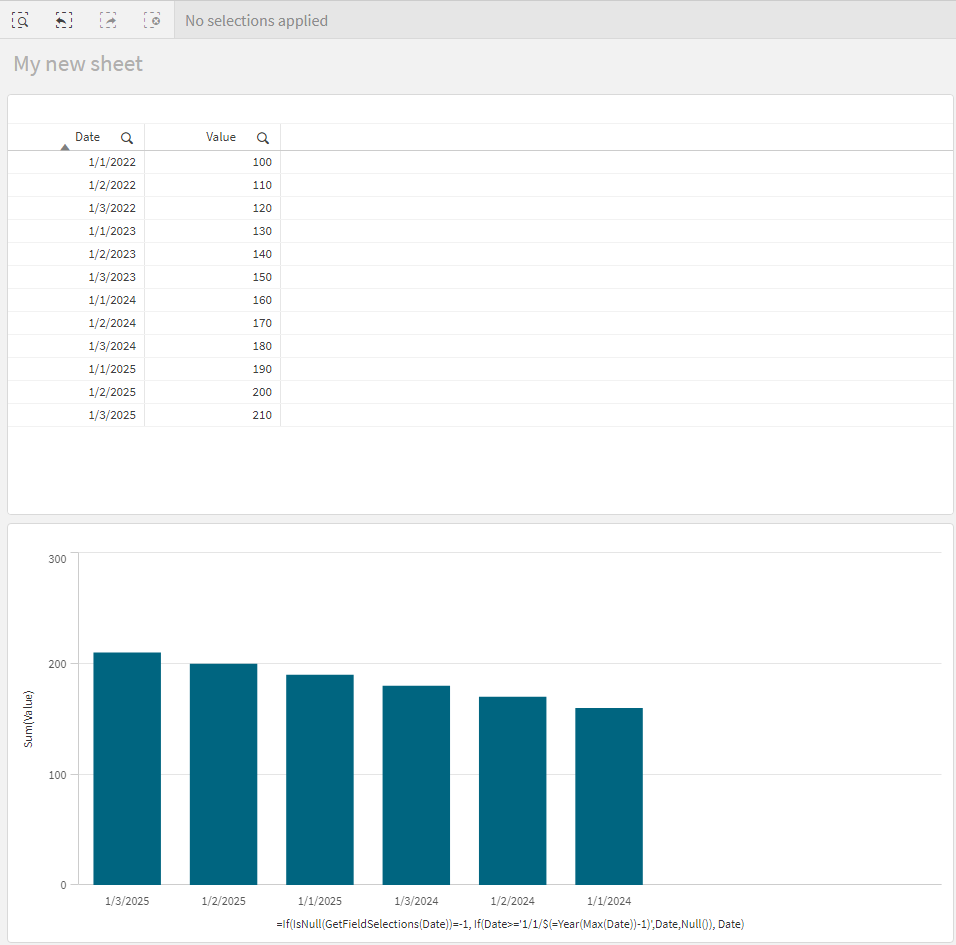
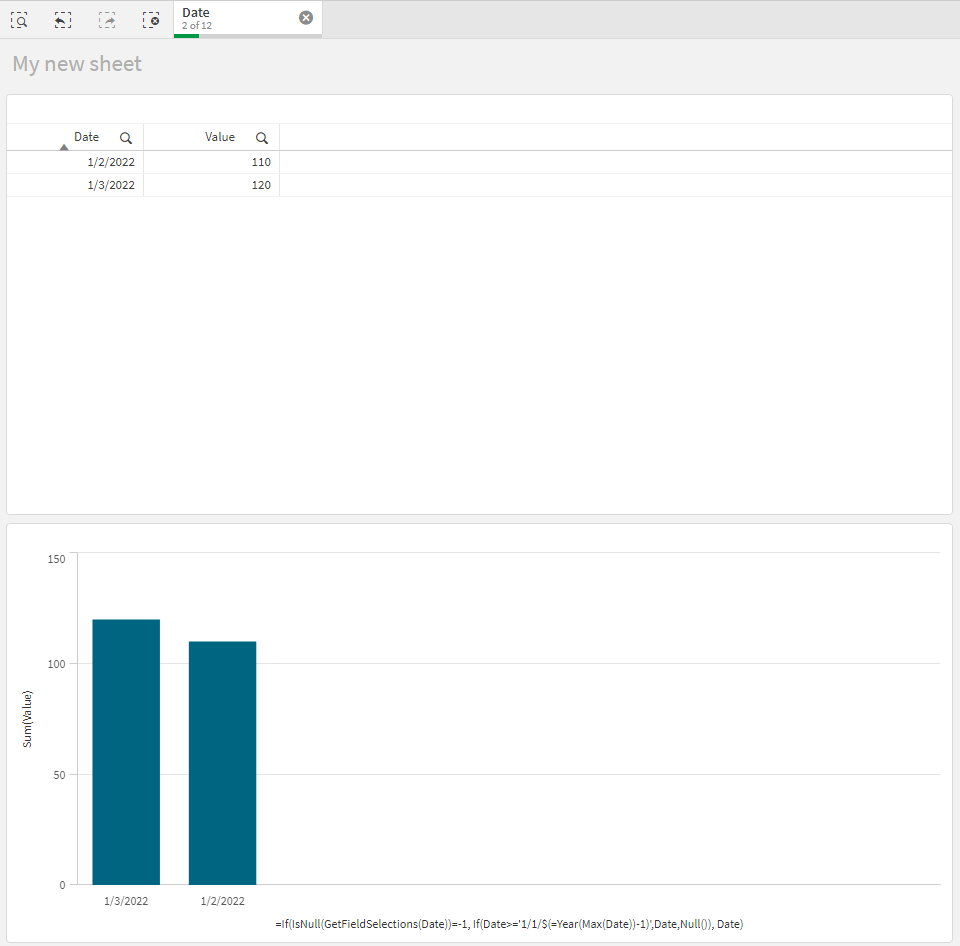
As you can see if I select the dates from year 2022, it will show me only the selected values. Otherwise, it will show me the values of last two years from the dataset.
I hope that this information was helpful. In case I have misunderstood the use case scenario, please elaborate in details by providing additional information. However, if it has helped you resolve the issue, addressed your concerns or at least pointed you in the right direction, please mark it as Accepted Solution to give further visibility to other community members.
- Mark as New
- Bookmark
- Subscribe
- Mute
- Subscribe to RSS Feed
- Permalink
- Report Inappropriate Content
Hello,
I am not 100% sure if I understood the exact use case scenario, however I would like to share with you my recommendation. You can take the idea behind the implementation and modify the expressions based on your needs. Keep in mind that there might be other ways to implement and get this outcome, but here is what worked for me:
1. I have loaded the dataset:
2. The created a Bar chart with dimension expression:
=If(IsNull(GetFieldSelections(Date))=-1, If(Date>='1/1/$(=Year(Max(Date))-1)',Date,Null()), Date)
- This expression checks if there are any selections in the field "Date".
- If there are not any selections, then it will evaluate: If(Date>='1/1/$(=Year(Max(Date))-1)',Date,Null()). This part will create a date value that represents the first day of the previous year of the max date value found in the dataset. Hence, the last 2 years from the dataset. If date is grater then it will return it, otherwise it will return Null()
- In case the initial check is not null, it means that there are selections in the field, so just return the Date filed as it is. The applied selections will be reflected on the displayed values
- Also remove the option "Include null values"
Outcome:
As you can see if I select the dates from year 2022, it will show me only the selected values. Otherwise, it will show me the values of last two years from the dataset.
I hope that this information was helpful. In case I have misunderstood the use case scenario, please elaborate in details by providing additional information. However, if it has helped you resolve the issue, addressed your concerns or at least pointed you in the right direction, please mark it as Accepted Solution to give further visibility to other community members.
- Mark as New
- Bookmark
- Subscribe
- Mute
- Subscribe to RSS Feed
- Permalink
- Report Inappropriate Content
Indeed you have to play with the "Include null values" option!
In the meantime, I’ve finally found the solution that’s similar to yours.
In dimension, I put ma field "YEAR"
I kept my 2 variables to use as the start and end date.
I remove "Include null values".
And I changed my measures as follows:
IF(GetSelectedCount([YEAR])=0,sum({<[YEAR]={">=$(LAST_TWO_YEARS) <=$(LAST_YEAR)"},[Rubrique]={'1'}>} [MONTANT]),
sum({<[Rubrique]={'1'}>} [MONTANT]))
I do get a graph over the last 2 years if I don’t have a selection and if I have selections, the years are influenced by these active selections.
Thank you!
Have a goodday.