Unlock a world of possibilities! Login now and discover the exclusive benefits awaiting you.
Announcements
Qlik Open Lakehouse is Now Generally Available! Discover the key highlights and partner resources here.
- Qlik Community
- :
- Forums
- :
- Analytics
- :
- Topics
- :
- Visualization and Usability
- :
- Multiple column values into Pie Chart
Options
- Subscribe to RSS Feed
- Mark Topic as New
- Mark Topic as Read
- Float this Topic for Current User
- Bookmark
- Subscribe
- Mute
- Printer Friendly Page
Turn on suggestions
Auto-suggest helps you quickly narrow down your search results by suggesting possible matches as you type.
Showing results for
Contributor III
2021-12-21
03:17 AM
- Mark as New
- Bookmark
- Subscribe
- Mute
- Subscribe to RSS Feed
- Permalink
- Report Inappropriate Content
Multiple column values into Pie Chart
Hello Community,
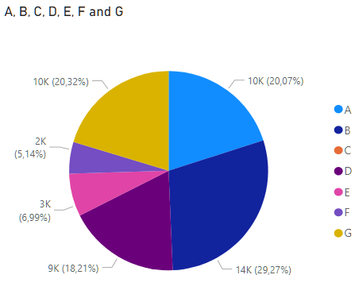
I am trying to create a pie chart that shows the sum of each A-G column. How can i show the values of each column in the same pie chart??
Dataset - Table3
Expected result:
1,075 Views
1 Solution
Accepted Solutions
Master
2021-12-21
03:22 AM
- Mark as New
- Bookmark
- Subscribe
- Mute
- Subscribe to RSS Feed
- Permalink
- Report Inappropriate Content
can u try using the crosstable,
u will get 2 fields like desc,amount
then in pie chart use desc as dim and sum(amount ) as measure
1,042 Views
2 Replies
Master
2021-12-21
03:22 AM
- Mark as New
- Bookmark
- Subscribe
- Mute
- Subscribe to RSS Feed
- Permalink
- Report Inappropriate Content
can u try using the crosstable,
u will get 2 fields like desc,amount
then in pie chart use desc as dim and sum(amount ) as measure
1,043 Views
Contributor III
2021-12-21
04:33 AM
Author
- Mark as New
- Bookmark
- Subscribe
- Mute
- Subscribe to RSS Feed
- Permalink
- Report Inappropriate Content
thanks @anat; is there any other way eg. using valueList?
988 Views
Community Browser

