Unlock a world of possibilities! Login now and discover the exclusive benefits awaiting you.

- Qlik Community
- :
- Forums
- :
- Analytics & AI
- :
- Products & Topics
- :
- Visualization and Usability
- :
- Need formula for Defect Burn Down Rate
- Subscribe to RSS Feed
- Mark Topic as New
- Mark Topic as Read
- Float this Topic for Current User
- Bookmark
- Subscribe
- Mute
- Printer Friendly Page

- Mark as New
- Bookmark
- Subscribe
- Mute
- Subscribe to RSS Feed
- Permalink
- Report Inappropriate Content
Need formula for Defect Burn Down Rate
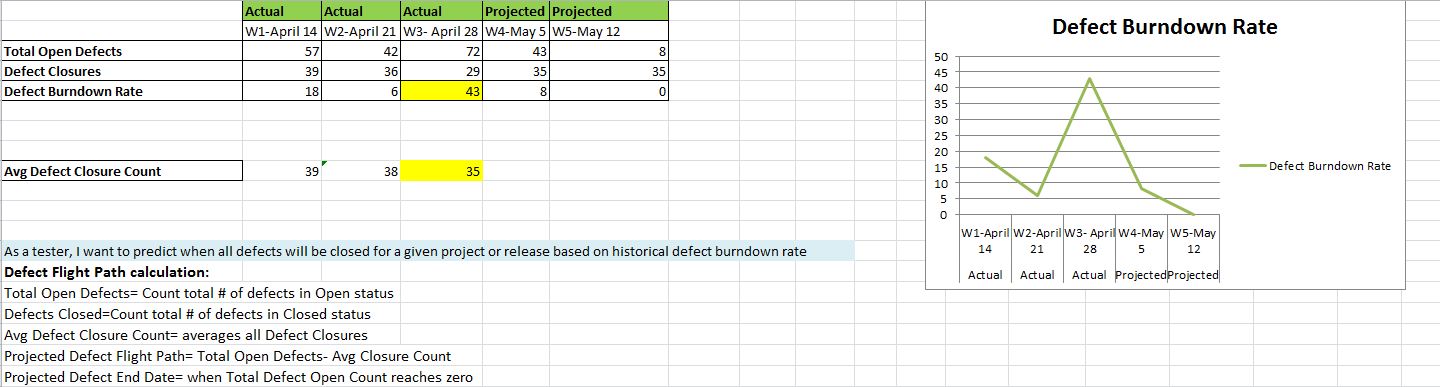
Please help to get formula for this graph in Qliksense
- Tags:
- dynamic formula
Accepted Solutions

 etrotter
- Mark as New
- Bookmark
- Subscribe
- Mute
- Subscribe to RSS Feed
- Permalink
- Report Inappropriate Content
Are you using a master calendar?
etrotter
- Mark as New
- Bookmark
- Subscribe
- Mute
- Subscribe to RSS Feed
- Permalink
- Report Inappropriate Content
Once your data is loaded, select line chart and your months would be your dimensions, and your Sum([Defect Burndown Rate]) would be your expression and it will create that graph.
- Mark as New
- Bookmark
- Subscribe
- Mute
- Subscribe to RSS Feed
- Permalink
- Report Inappropriate Content
the data of dimension is like a current month but I am not sure How to divide the month in different weeks like Week1 Week 2 Week 3 Week4 and Week 5.
etrotter
- Mark as New
- Bookmark
- Subscribe
- Mute
- Subscribe to RSS Feed
- Permalink
- Report Inappropriate Content
Are you using a master calendar?
- Mark as New
- Bookmark
- Subscribe
- Mute
- Subscribe to RSS Feed
- Permalink
- Report Inappropriate Content
No Erica I am not using Master Calendar...Lets say if CurrentMonth is September so I want to divide the current month in 5 Weeks and use it as Dimension.
 priyalvp24
- Mark as New
- Bookmark
- Subscribe
- Mute
- Subscribe to RSS Feed
- Permalink
- Report Inappropriate Content
Create week using master calendar.
Use that week field as dimension.