Unlock a world of possibilities! Login now and discover the exclusive benefits awaiting you.
- Qlik Community
- :
- Forums
- :
- Analytics & AI
- :
- Products & Topics
- :
- Visualization and Usability
- :
- Re: Pivot Table - Background Colour by Expression
- Subscribe to RSS Feed
- Mark Topic as New
- Mark Topic as Read
- Float this Topic for Current User
- Bookmark
- Subscribe
- Mute
- Printer Friendly Page
- Mark as New
- Bookmark
- Subscribe
- Mute
- Subscribe to RSS Feed
- Permalink
- Report Inappropriate Content
Pivot Table - Background Colour by Expression
Hi All,
I am trying to create a conditionally formatted pivot table. I am trying to use the colormix2 function in the Background color expression box to create the conditional formatting, however it is only throwing one color out.
ColorMix2((Count(DISTINCT {<status={'1'}>} UNIQUE_ID)/
Count(DISTINCT UNIQUE_ID)) , rgb(180,212,218), rgb(28,95,158))
Has anyone any ideas how I could modify this code in order to have 4 distinct colors based on the min to max values in the table?

Regards
Finbar
- « Previous Replies
-
- 1
- 2
- Next Replies »
- Mark as New
- Bookmark
- Subscribe
- Mute
- Subscribe to RSS Feed
- Permalink
- Report Inappropriate Content
try AGGR(
- Mark as New
- Bookmark
- Subscribe
- Mute
- Subscribe to RSS Feed
- Permalink
- Report Inappropriate Content
Where should I insert aggr(?
- Mark as New
- Bookmark
- Subscribe
- Mute
- Subscribe to RSS Feed
- Permalink
- Report Inappropriate Content
Hi Finbar,
you can watch at your calculation. Maybe the Values are near to the same.
Just put this as an Measure on your table:
(Count(DISTINCT {<status={'1'}>} UNIQUE_ID)/
Count(DISTINCT UNIQUE_ID))
I testest your Colormix function. For me it's working
- Mark as New
- Bookmark
- Subscribe
- Mute
- Subscribe to RSS Feed
- Permalink
- Report Inappropriate Content
Hi stiffi88,
I have this as the measure
(Count(DISTINCT {<status={'1'}>} UNIQUE_ID)/
Count(DISTINCT UNIQUE_ID))
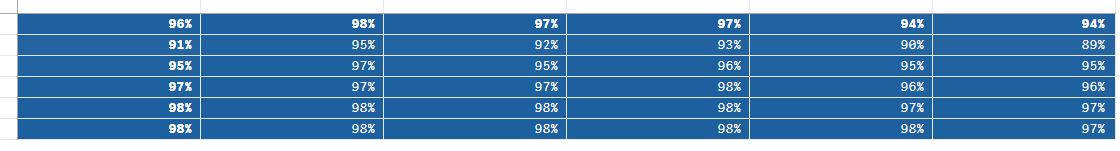
but for some reason it isn't creating distinct colors from the code i have inputted in the background color expression. The range is from around 90% to 100%.
- Mark as New
- Bookmark
- Subscribe
- Mute
- Subscribe to RSS Feed
- Permalink
- Report Inappropriate Content
Can you paste a screenshot from the result from these Measure?
- Mark as New
- Bookmark
- Subscribe
- Mute
- Subscribe to RSS Feed
- Permalink
- Report Inappropriate Content
Hi,
Its the screenshot I inserted earlier.
- Mark as New
- Bookmark
- Subscribe
- Mute
- Subscribe to RSS Feed
- Permalink
- Report Inappropriate Content
Can you maybe share your qvf file with some example data?
- Mark as New
- Bookmark
- Subscribe
- Mute
- Subscribe to RSS Feed
- Permalink
- Report Inappropriate Content
Hi,
I can't share the data due to company policy, sorry!
- Mark as New
- Bookmark
- Subscribe
- Mute
- Subscribe to RSS Feed
- Permalink
- Report Inappropriate Content
try this
ColorMix1( rank(total EXPRESSION ) / NoOfRows(TOTAL) , $(vColorMixDark), $(vColorMixLight))
- « Previous Replies
-
- 1
- 2
- Next Replies »