Unlock a world of possibilities! Login now and discover the exclusive benefits awaiting you.
- Qlik Community
- :
- Forums
- :
- Analytics & AI
- :
- Products & Topics
- :
- Visualization and Usability
- :
- Pivot Table Hierarchy N levels
- Subscribe to RSS Feed
- Mark Topic as New
- Mark Topic as Read
- Float this Topic for Current User
- Bookmark
- Subscribe
- Mute
- Printer Friendly Page
- Mark as New
- Bookmark
- Subscribe
- Mute
- Subscribe to RSS Feed
- Permalink
- Report Inappropriate Content
Pivot Table Hierarchy N levels
Good Morning,
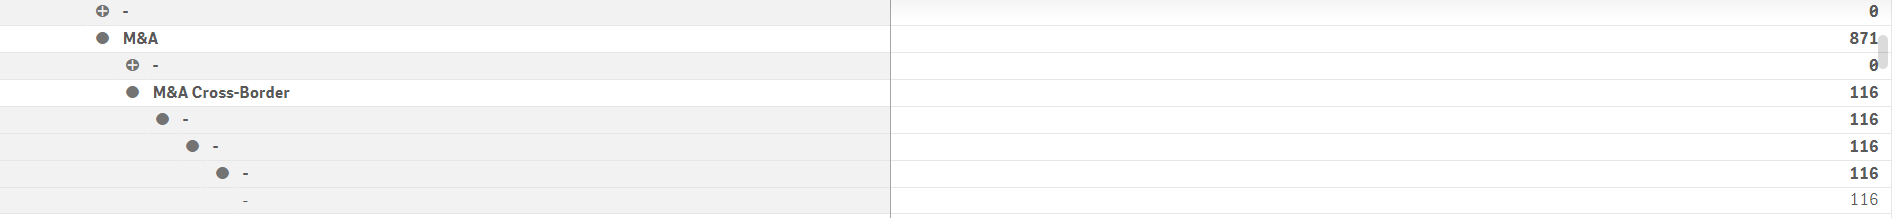
I have a hierarchy of 9 levels, of which there are levels that do not reach level 9, for example there is a value that reaches level 5 and there are others that reach level 9, the values reach the lowest level, my problem is that when I represent the 9 levels in a pivot table, the levels that do not reach level 9, I paint so many rows with zero value as levels are missing until I reach level 9. I do not see how I can hide those rows so that the presentation of the table is appropriate.
I have tried to remove null values from the dimensions but all the levels that do not reach level 9, I deleted them.
I would appreciate it if someone could help me!!
Thanks in advance!!
a greeting