Unlock a world of possibilities! Login now and discover the exclusive benefits awaiting you.
- Qlik Community
- :
- Forums
- :
- Analytics & AI
- :
- Products & Topics
- :
- Visualization and Usability
- :
- Problems with date label Dygraphs
- Subscribe to RSS Feed
- Mark Topic as New
- Mark Topic as Read
- Float this Topic for Current User
- Bookmark
- Subscribe
- Mute
- Printer Friendly Page
- Mark as New
- Bookmark
- Subscribe
- Mute
- Subscribe to RSS Feed
- Permalink
- Report Inappropriate Content
Problems with date label Dygraphs
Hi All,
The X-axis label contains a Date (D/M/YYYY) but instead of showing 1/1/2015 etc I have the number. Anyone got an idea???
Accepted Solutions
- Mark as New
- Bookmark
- Subscribe
- Mute
- Subscribe to RSS Feed
- Permalink
- Report Inappropriate Content
Bruno is right. Under graph options - Input data, set the x-axis to date. Then match your raw data date format to what is used in the example app (YYYY/MM/DD).
Then you won't need to use a date function. It will appear as (MMM YYYY) in your chart.
Mike
- Mark as New
- Bookmark
- Subscribe
- Mute
- Subscribe to RSS Feed
- Permalink
- Report Inappropriate Content
Can you upload a sample qvf?
Andy
- Mark as New
- Bookmark
- Subscribe
- Mute
- Subscribe to RSS Feed
- Permalink
- Report Inappropriate Content
try wrapping you dimension in a date function: date([datefield],'MM/DD/YYYY')
- Mark as New
- Bookmark
- Subscribe
- Mute
- Subscribe to RSS Feed
- Permalink
- Report Inappropriate Content
Hi
have you chek that :
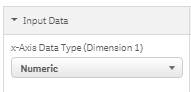
x-Axis Data Type (Dimension 1) - The data type for values on the x-axis, provided by the first dimension. This may be set to either Numeric or Date. (default: Numeric)
and if it is set to Date ,
Try to use date function for your dimension
your dimension = date
date(date,'DD/MM/YYYY')
or date#(date,'DD/MM/YYYY')
bruno
- Mark as New
- Bookmark
- Subscribe
- Mute
- Subscribe to RSS Feed
- Permalink
- Report Inappropriate Content
Yes I can
- Mark as New
- Bookmark
- Subscribe
- Mute
- Subscribe to RSS Feed
- Permalink
- Report Inappropriate Content
Bruno is right. Under graph options - Input data, set the x-axis to date. Then match your raw data date format to what is used in the example app (YYYY/MM/DD).
Then you won't need to use a date function. It will appear as (MMM YYYY) in your chart.
Mike