Unlock a world of possibilities! Login now and discover the exclusive benefits awaiting you.

- Qlik Community
- :
- Forums
- :
- Analytics & AI
- :
- Products & Topics
- :
- Visualization and Usability
- :
- Re: Qlik Sense - How to get between 2 numeric valu...
- Subscribe to RSS Feed
- Mark Topic as New
- Mark Topic as Read
- Float this Topic for Current User
- Bookmark
- Subscribe
- Mute
- Printer Friendly Page

 YG
YG
- Mark as New
- Bookmark
- Subscribe
- Mute
- Subscribe to RSS Feed
- Permalink
- Report Inappropriate Content
Qlik Sense - How to get between 2 numeric values in line a chart
Hi All,
I am trying to limit last 5 weeks data only for current year and past year same period.
I created 2 measures (Dynamic)
CurWeekNo and Vweek
I tried = rangemin(rangemax('CurWeekNo ', -5), 1) // Didnt work
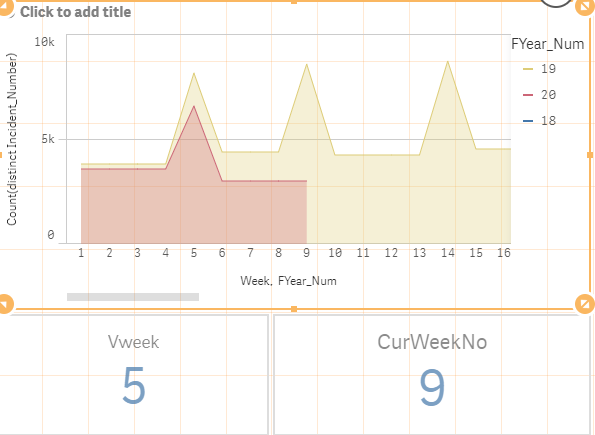
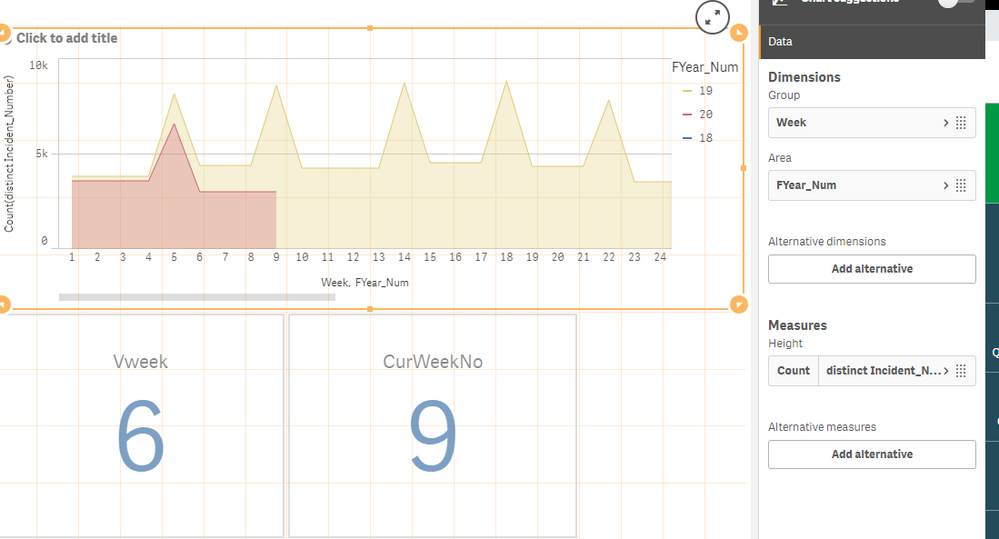
My requirement is to get above same chart but Vweek BETWEEN CurWeekNo. Anyone can help would be appreciated. Thanks
Accepted Solutions

 _ylc
_ylc
- Mark as New
- Bookmark
- Subscribe
- Mute
- Subscribe to RSS Feed
- Permalink
- Report Inappropriate Content
use this:
Count({<Week={">=$(=$(vCurrWeekNo)-$(vWeek))"}>} DISTINCT Incident_Number)
_ylc
- Mark as New
- Bookmark
- Subscribe
- Mute
- Subscribe to RSS Feed
- Permalink
- Report Inappropriate Content
You should put it on your expression, not in the dimension.
Something like this:

Edit:
- Above line chart is using the set analysis
- Below line chat is just sum(Value)

 Vegar
Vegar
- Mark as New
- Bookmark
- Subscribe
- Mute
- Subscribe to RSS Feed
- Permalink
- Report Inappropriate Content
Try using set analysis to solve your issue. Something like this.
Count({< Week={">=$(CurWeekNo)-$(Vweek)"}>}distinct ID)
Qlik Community MVP
YG
- Mark as New
- Bookmark
- Subscribe
- Mute
- Subscribe to RSS Feed
- Permalink
- Report Inappropriate Content
Hi Vegar,
I used it as,
=Count({< Week={">=$(CurWeekNo)-$(Vweek)"}>}distinct Incident_Number)
Then I tried,
=Count({< Week={">=$(CurWeekNo)-$(Vweek)"}>})
both coming up as invalid. Not really sure where is the invalid part is in this
_ylc
- Mark as New
- Bookmark
- Subscribe
- Mute
- Subscribe to RSS Feed
- Permalink
- Report Inappropriate Content
use this:
Count({<Week={">=$(=$(vCurrWeekNo)-$(vWeek))"}>} DISTINCT Incident_Number)
YG
- Mark as New
- Bookmark
- Subscribe
- Mute
- Subscribe to RSS Feed
- Permalink
- Report Inappropriate Content
Thanks for the reply _yls,
Still the its a "Invalid dimension"
I tried,
Count({<Week={">=$(=$(CurrWeekNo)-$(vWeek))"}>} DISTINCT Incident_Number)
Then,
=Num(Count({<Week={">=$(=$(CurrWeekNo)-$(vWeek))"}>} DISTINCT Incident_Number))
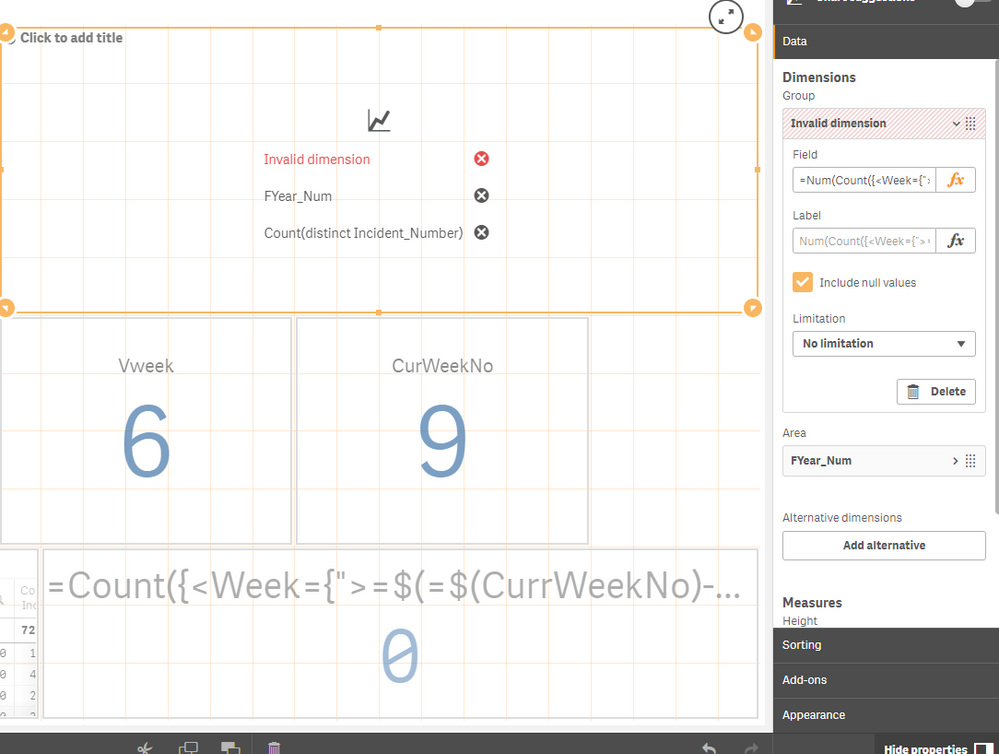
Also I tried totally different approach using - Aggr( If( rank(Week)<6, Week), Week) it came close but it goes to max Week number 53 but still I cant get it Currentweek number from this
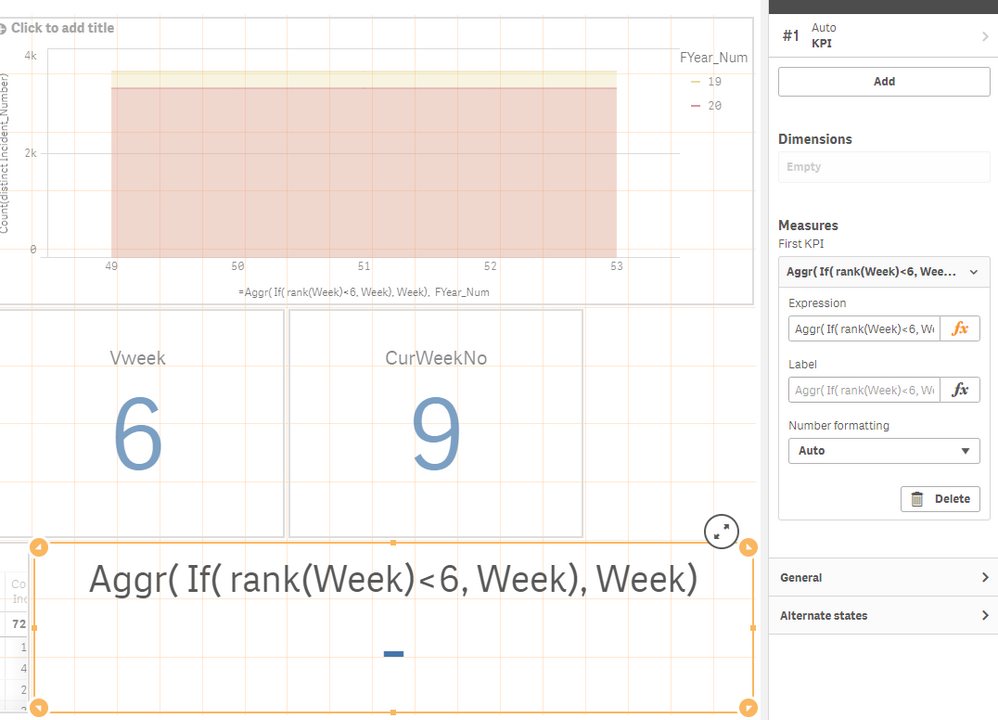
I could be doing a mistake here I still cant figure it out.
_ylc
- Mark as New
- Bookmark
- Subscribe
- Mute
- Subscribe to RSS Feed
- Permalink
- Report Inappropriate Content
You should put it on your expression, not in the dimension.
Something like this:
Edit:
- Above line chart is using the set analysis
- Below line chat is just sum(Value)
YG
- Mark as New
- Bookmark
- Subscribe
- Mute
- Subscribe to RSS Feed
- Permalink
- Report Inappropriate Content
Awesome!! Work like a charm now. I sort of knew I was doing something wrong not the expression you gave me. Thanks _ylc
