Unlock a world of possibilities! Login now and discover the exclusive benefits awaiting you.
- Qlik Community
- :
- Forums
- :
- Analytics
- :
- Topics
- :
- Visualization and Usability
- :
- Qlik Sense Pivot Table Totals not aggregating corr...
- Subscribe to RSS Feed
- Mark Topic as New
- Mark Topic as Read
- Float this Topic for Current User
- Bookmark
- Subscribe
- Mute
- Printer Friendly Page
- Mark as New
- Bookmark
- Subscribe
- Mute
- Subscribe to RSS Feed
- Permalink
- Report Inappropriate Content
Qlik Sense Pivot Table Totals not aggregating correctly
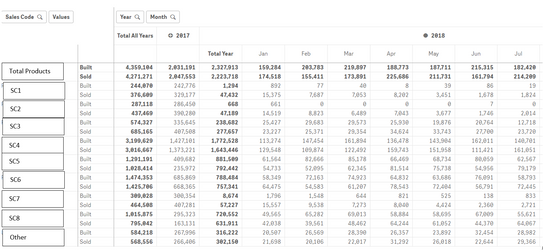
In Qlik Sense I have a pivot chart as shown below. A product can have multiple sales codes and I need to display the count of products built and sold by month using sales code as a dimension. My original expression for the measures:
count({<DateType={'Built'}>}Distinct [ProductID]). ( I change DateType to 'Sold' for the other measure)
I did not use aggr at all. Then realized the totals were off. After reading as many posts as I could on AGGR and pivot tables I tried this expression for my measure - and it still gave incorrect totals.
sum(aggr(count({<DateType={'Sold'}>}Distinct [ProductID]),Year,Month,[Sales Code]))
I was able to get the correct numbers by checking the dimensionality() to determine what dimensions to apply AGGR to and when
IF(Dimensionality()=0,sum(aggr(count({<DateType={'Sold'}>}Distinct [ProductID]),Year,Month)),
sum(aggr(count({<DateType={'Sold'}>}Distinct [ProductID]),Year,Month,[Sales Code])))
The problem is now it takes extremely long to render the chart. I hope someone can help with this as I have several similar charts to make.
Below chart 1 with my original measure expression and also using aggr without the addition of the IF statement for dimensionality.
Below is chart 2 I was able to get correct totals using aggr and dimensionality however the chart takes too long to render. I don't understand why I had to use dimensionality to get the correct totals

- Tags:
- pivot table
